pacman::p_load(lubridate, ggthemes, reactable, reactablefmtr, gt, gtExtras, svglite, tidyverse)Quarto Dashboard
coffeechain <- read_rds("data/CoffeeChain.rds")productSales <- coffeechain %>%
group_by(`Product`) %>%
summarise (`target` = sum(`Budget Sales`),
`current` = sum(`Sales`)) %>%
ungroup ()productProfit <- coffeechain %>%
group_by(`Product`) %>%
summarise (`target` = sum(`Budget Profit`),
`current` = sum(`Profit`)) %>%
ungroup ()Column
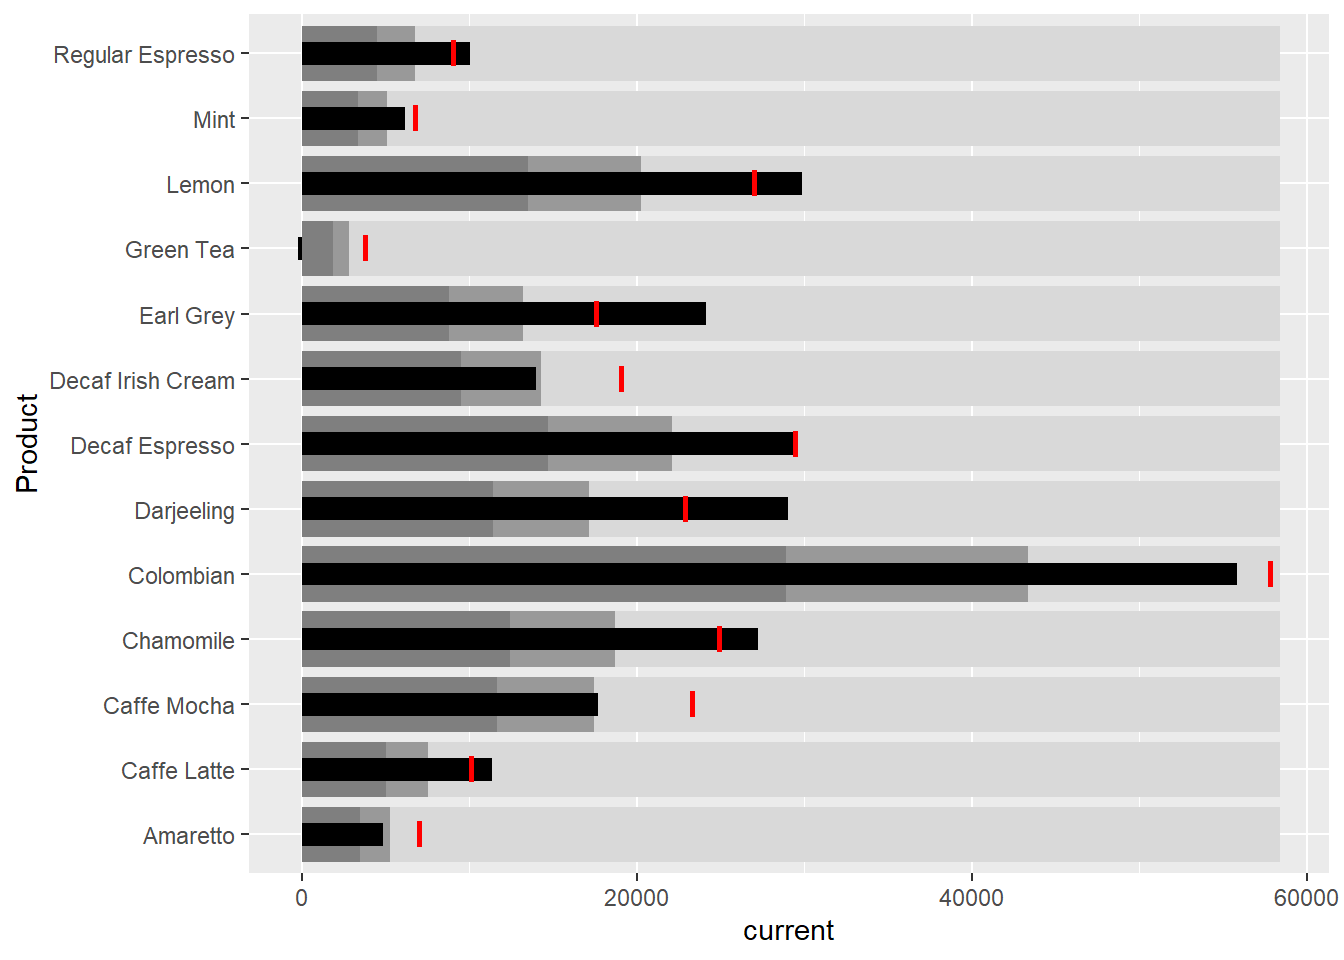
ggplot(productSales, aes(Product, current)) +
  geom_col(aes(Product, max(target) * 1.01),
           fill="grey85", width=0.85) +
  geom_col(aes(Product, target * 0.75),
           fill="grey60", width=0.85) +
  geom_col(aes(Product, target * 0.5),
           fill="grey50", width=0.85) +
  geom_col(aes(Product, current),
           width=0.35,
           fill = "black") +
  geom_errorbar(aes(y = target,
                    x = Product,
                    ymin = target,
                    ymax= target),
                width = .4,
                colour = "red",
                size = 1) +
  coord_flip()
Warning: Using `size` aesthetic for lines was deprecated in ggplot2 3.4.0.
ℹ Please use `linewidth` instead.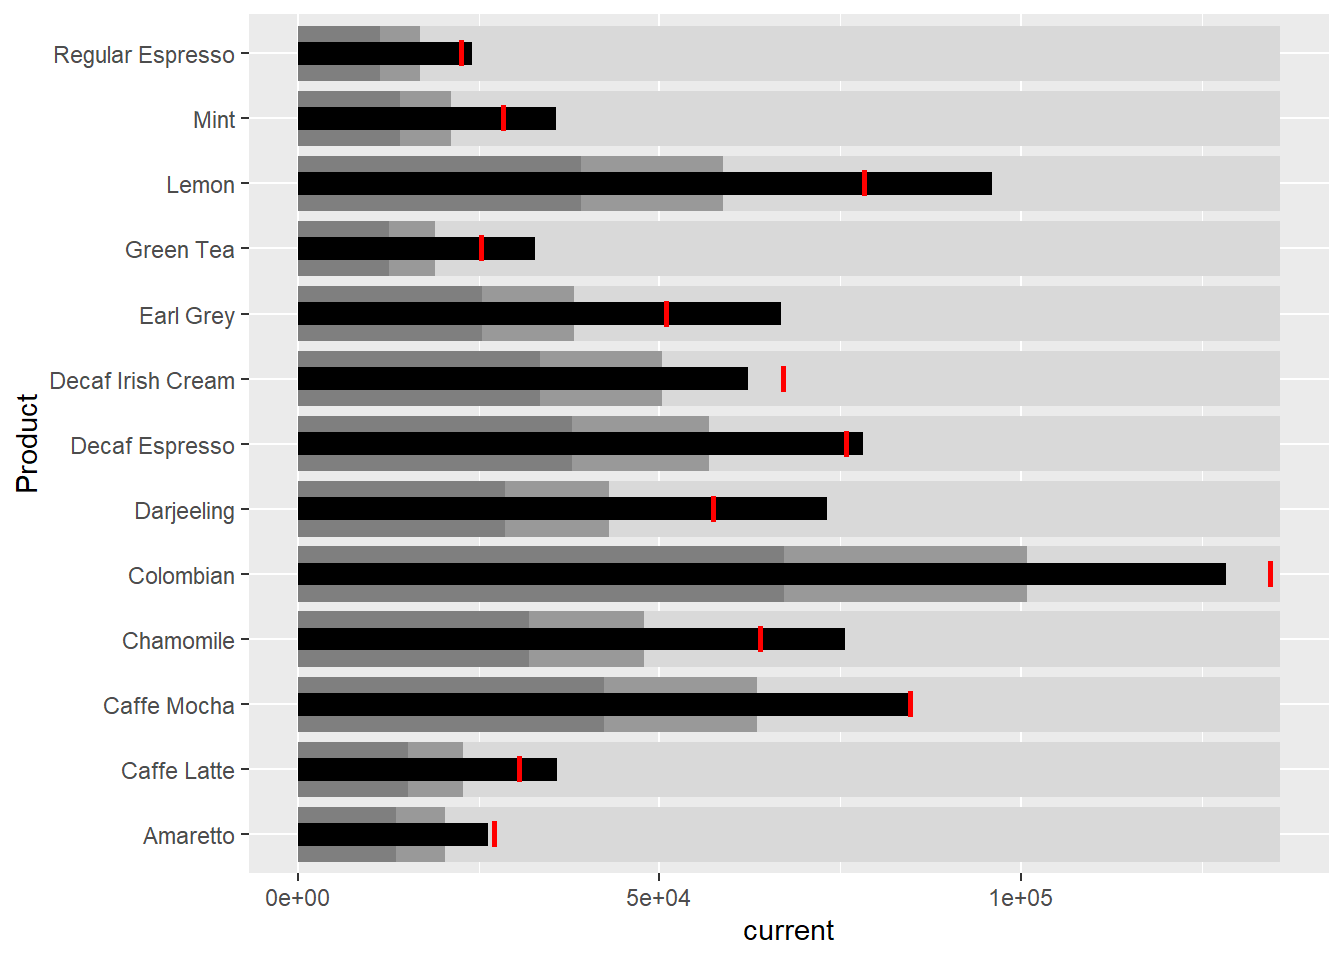
Column
ggplot(productProfit, aes(Product, current)) +
  geom_col(aes(Product, max(target) * 1.01),
           fill="grey85", width=0.85) +
  geom_col(aes(Product, target * 0.75),
           fill="grey60", width=0.85) +
  geom_col(aes(Product, target * 0.5),
           fill="grey50", width=0.85) +
  geom_col(aes(Product, current),
           width=0.35,
           fill = "black") +
  geom_errorbar(aes(y = target,
                    x = Product,
                    ymin = target,
                    ymax= target),
                width = .4,
                colour = "red",
                size = 1) +
  coord_flip()