In Class Ex 10 - Dashboard
Using Tableau with Access
We are using the coffee chain access data - and loading it into Tableau.
Tableau automatically shows a CoffeeChain Query.
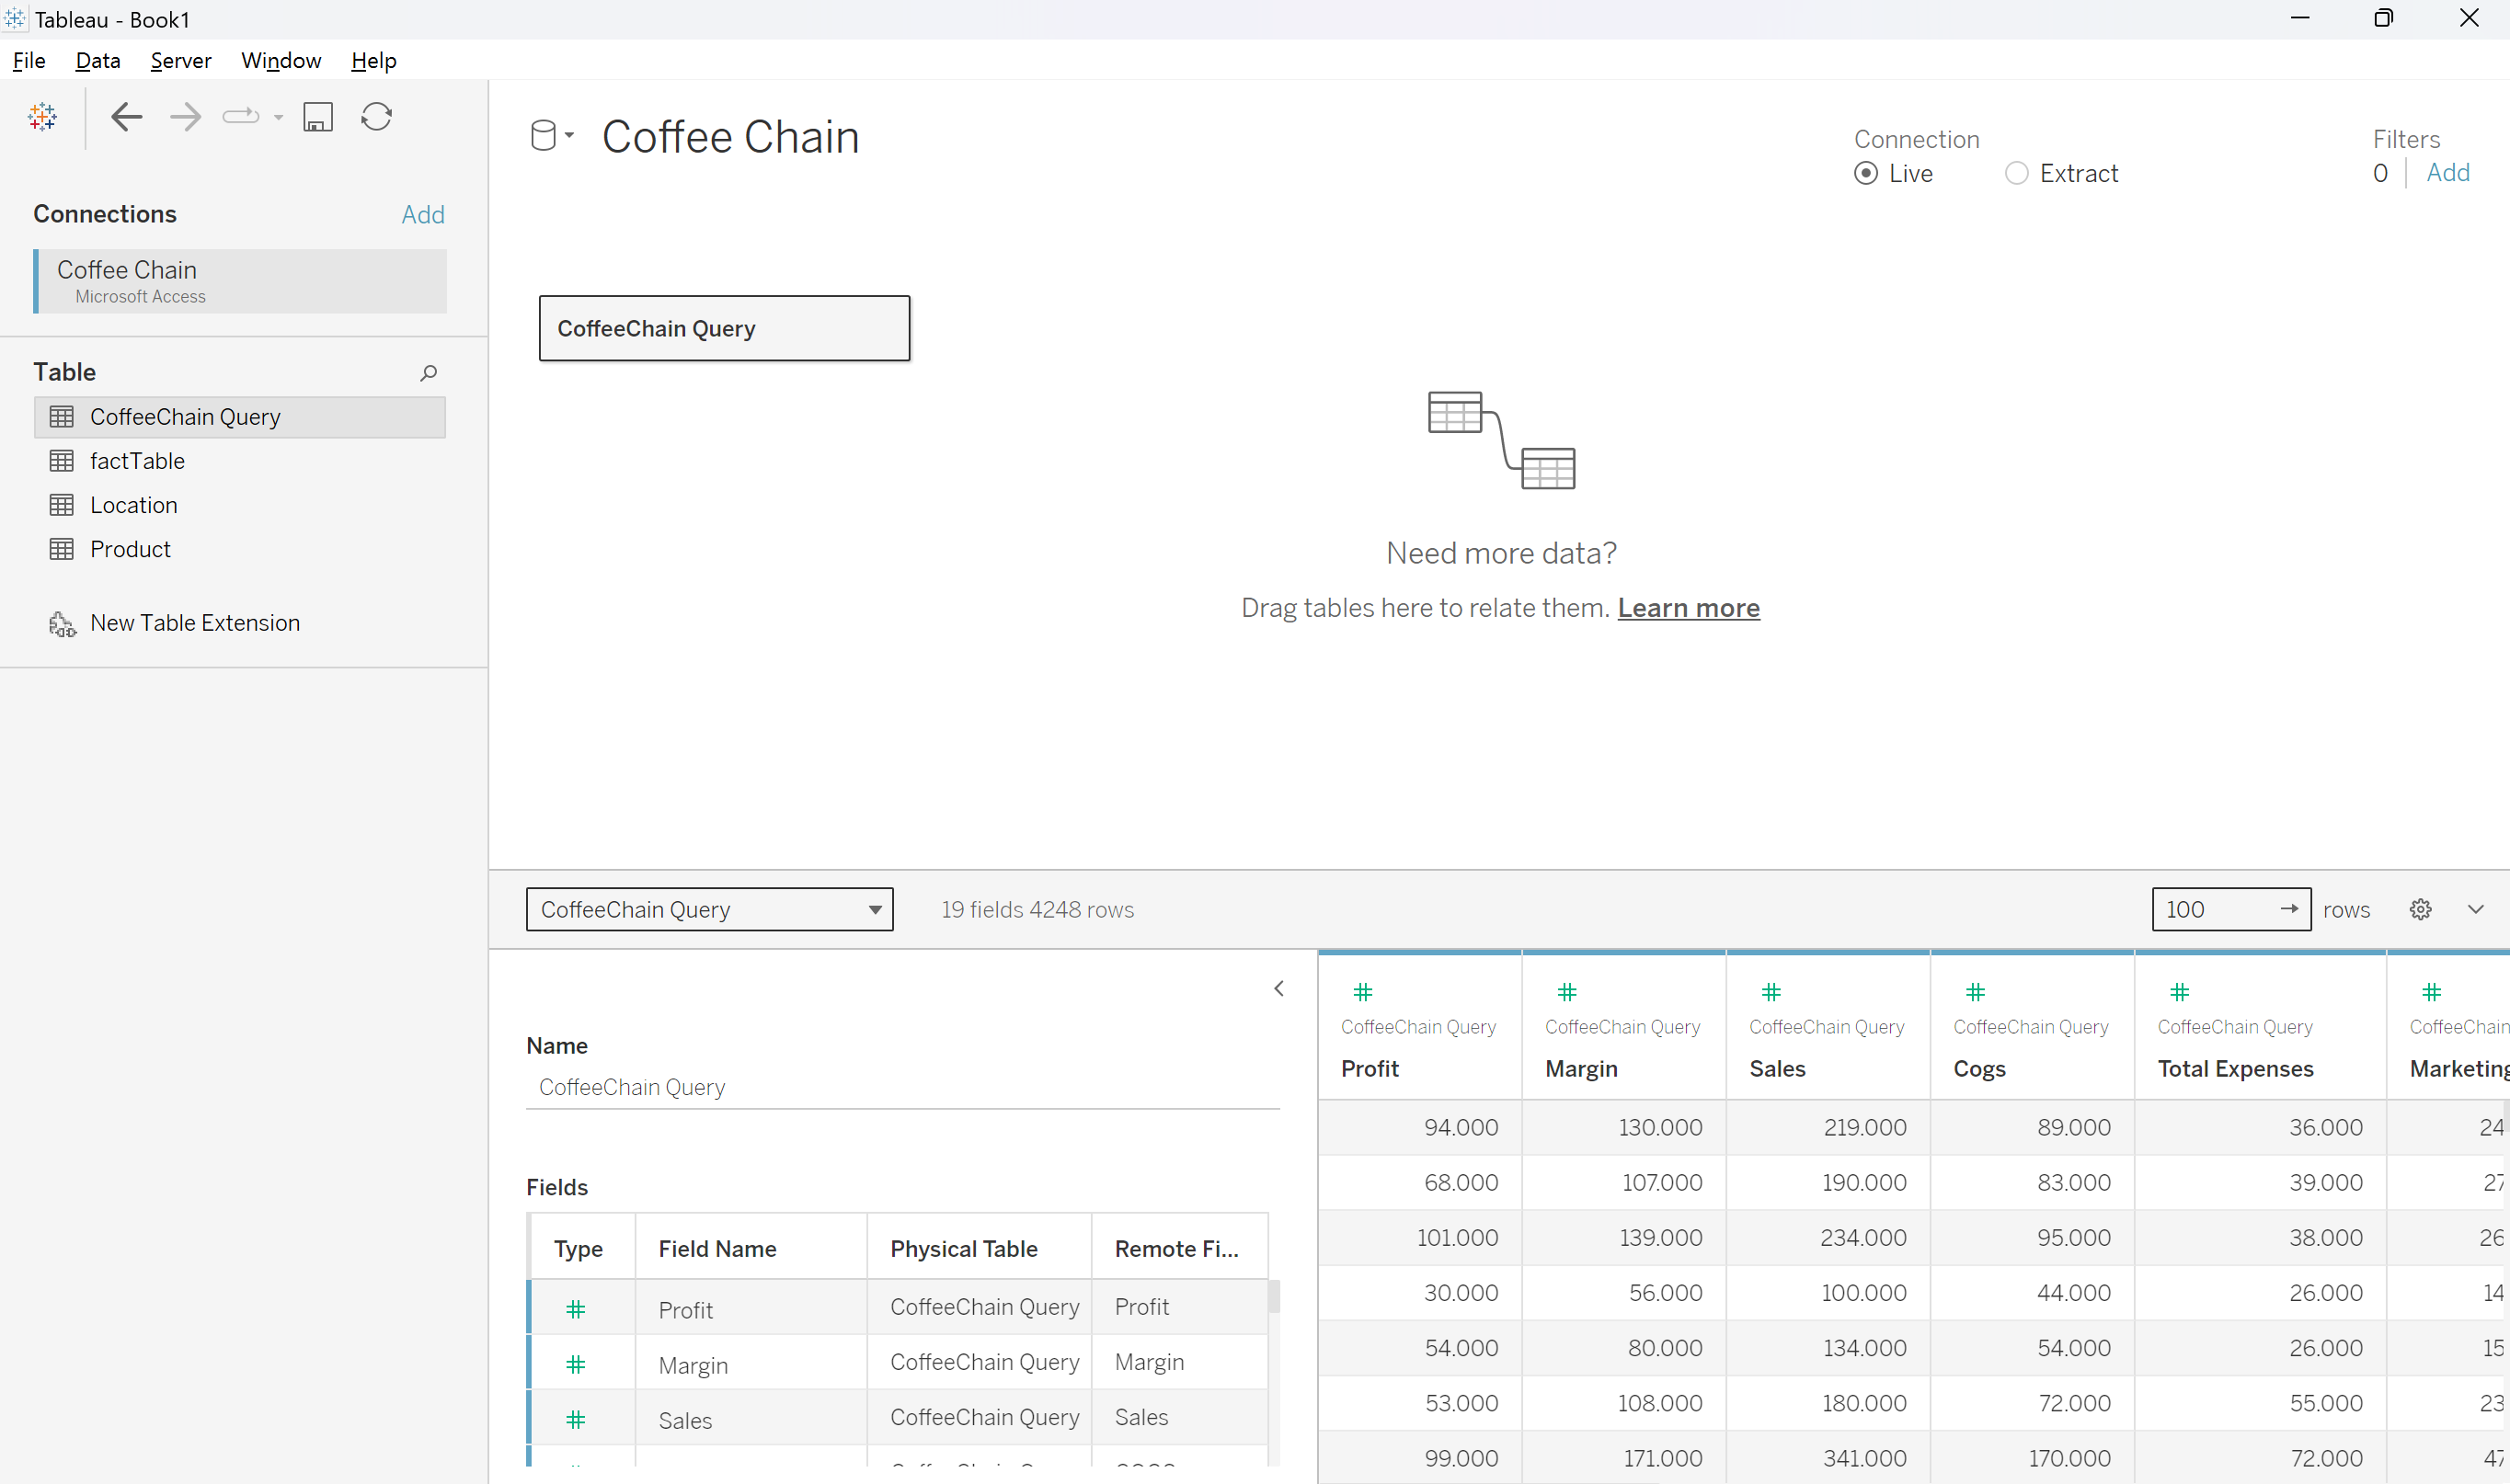
Imported into Tableau
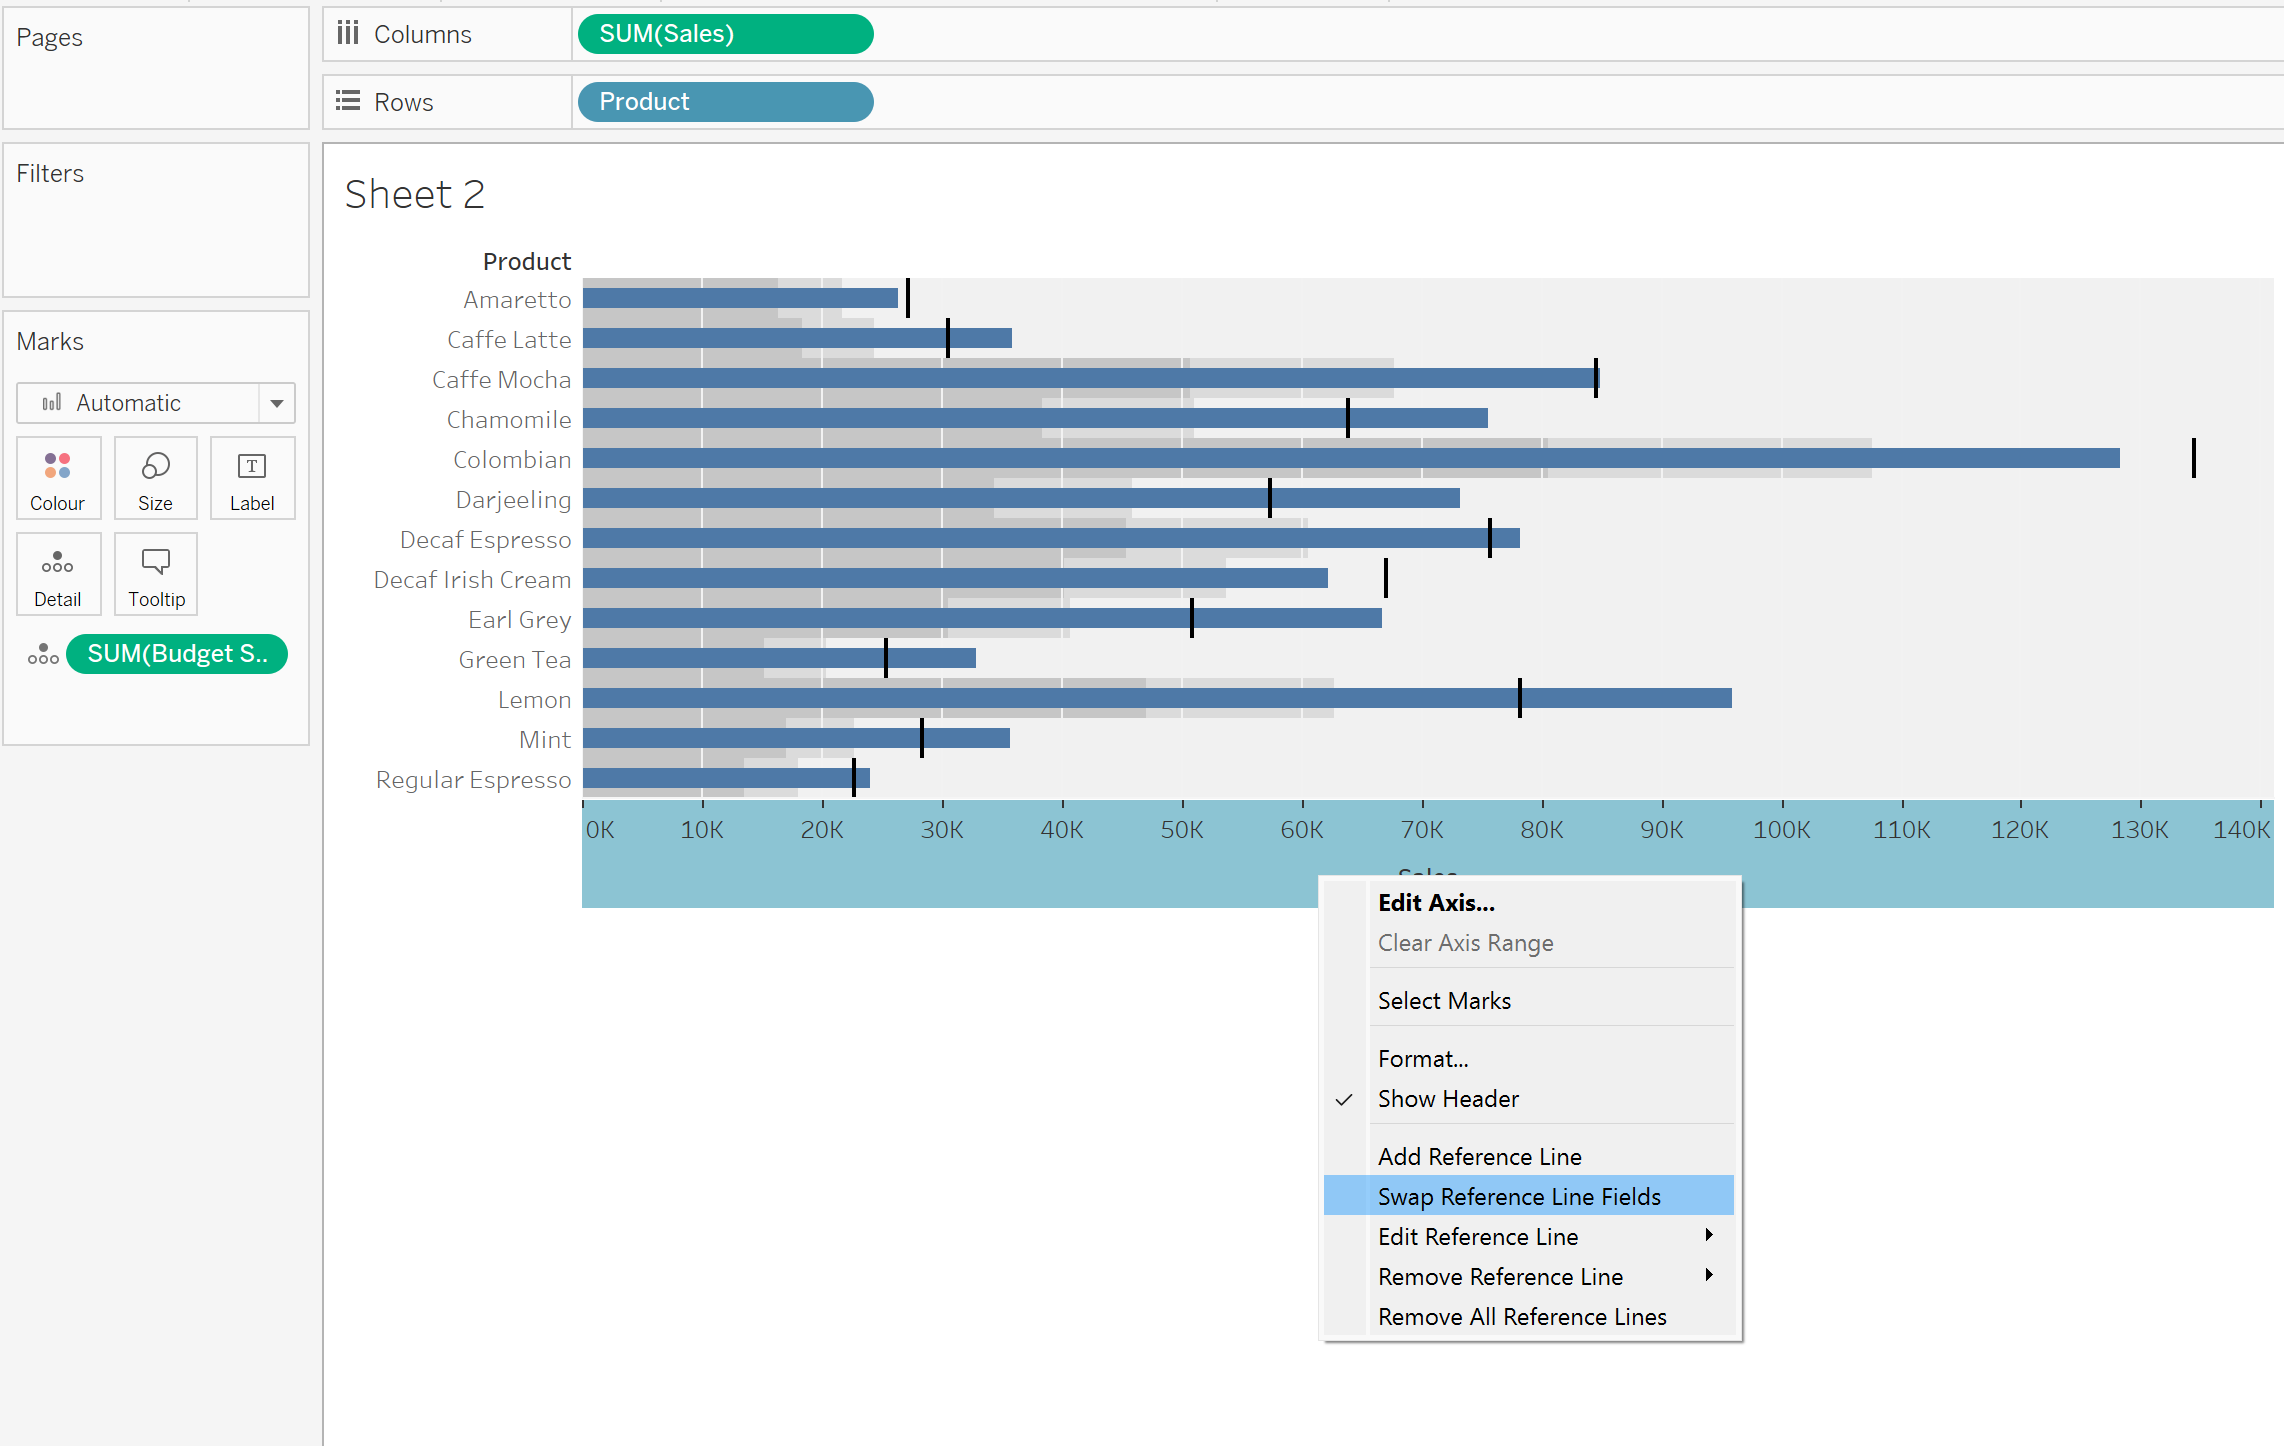
Drawing Bullet Graphs
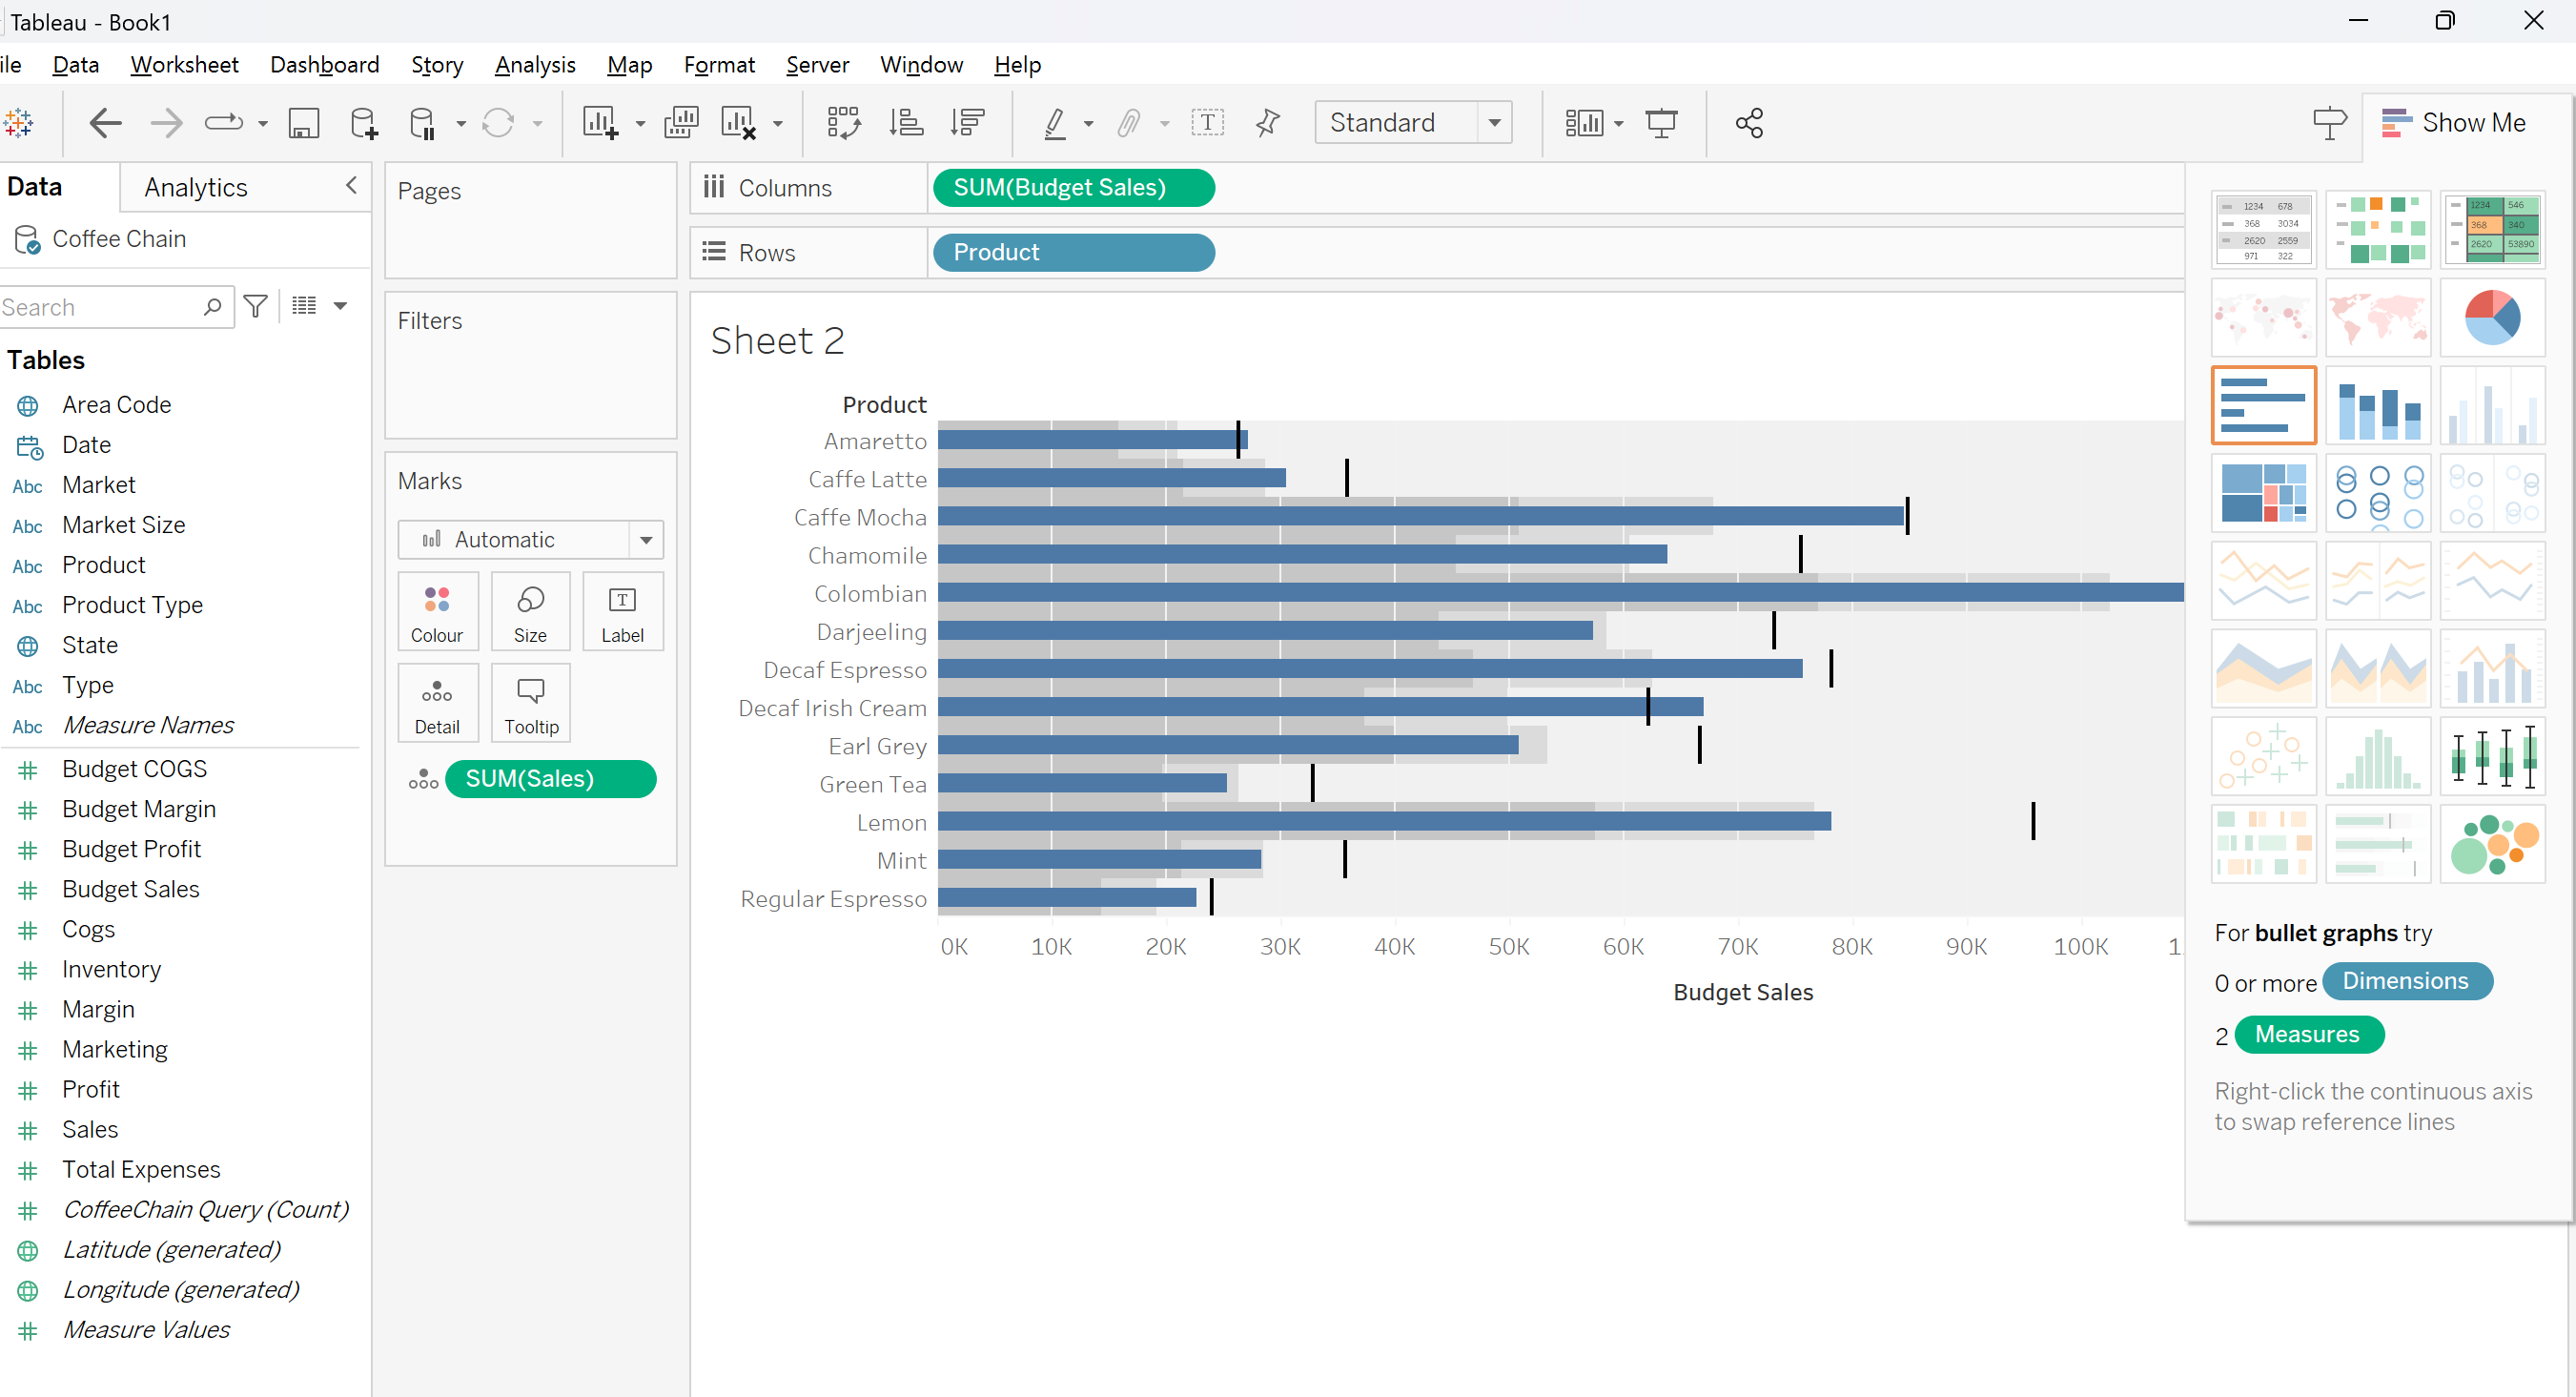
Bullet graph is part of the selection under Show Me.
Need to swap the reference line field - so that the bar shows the budget sales.
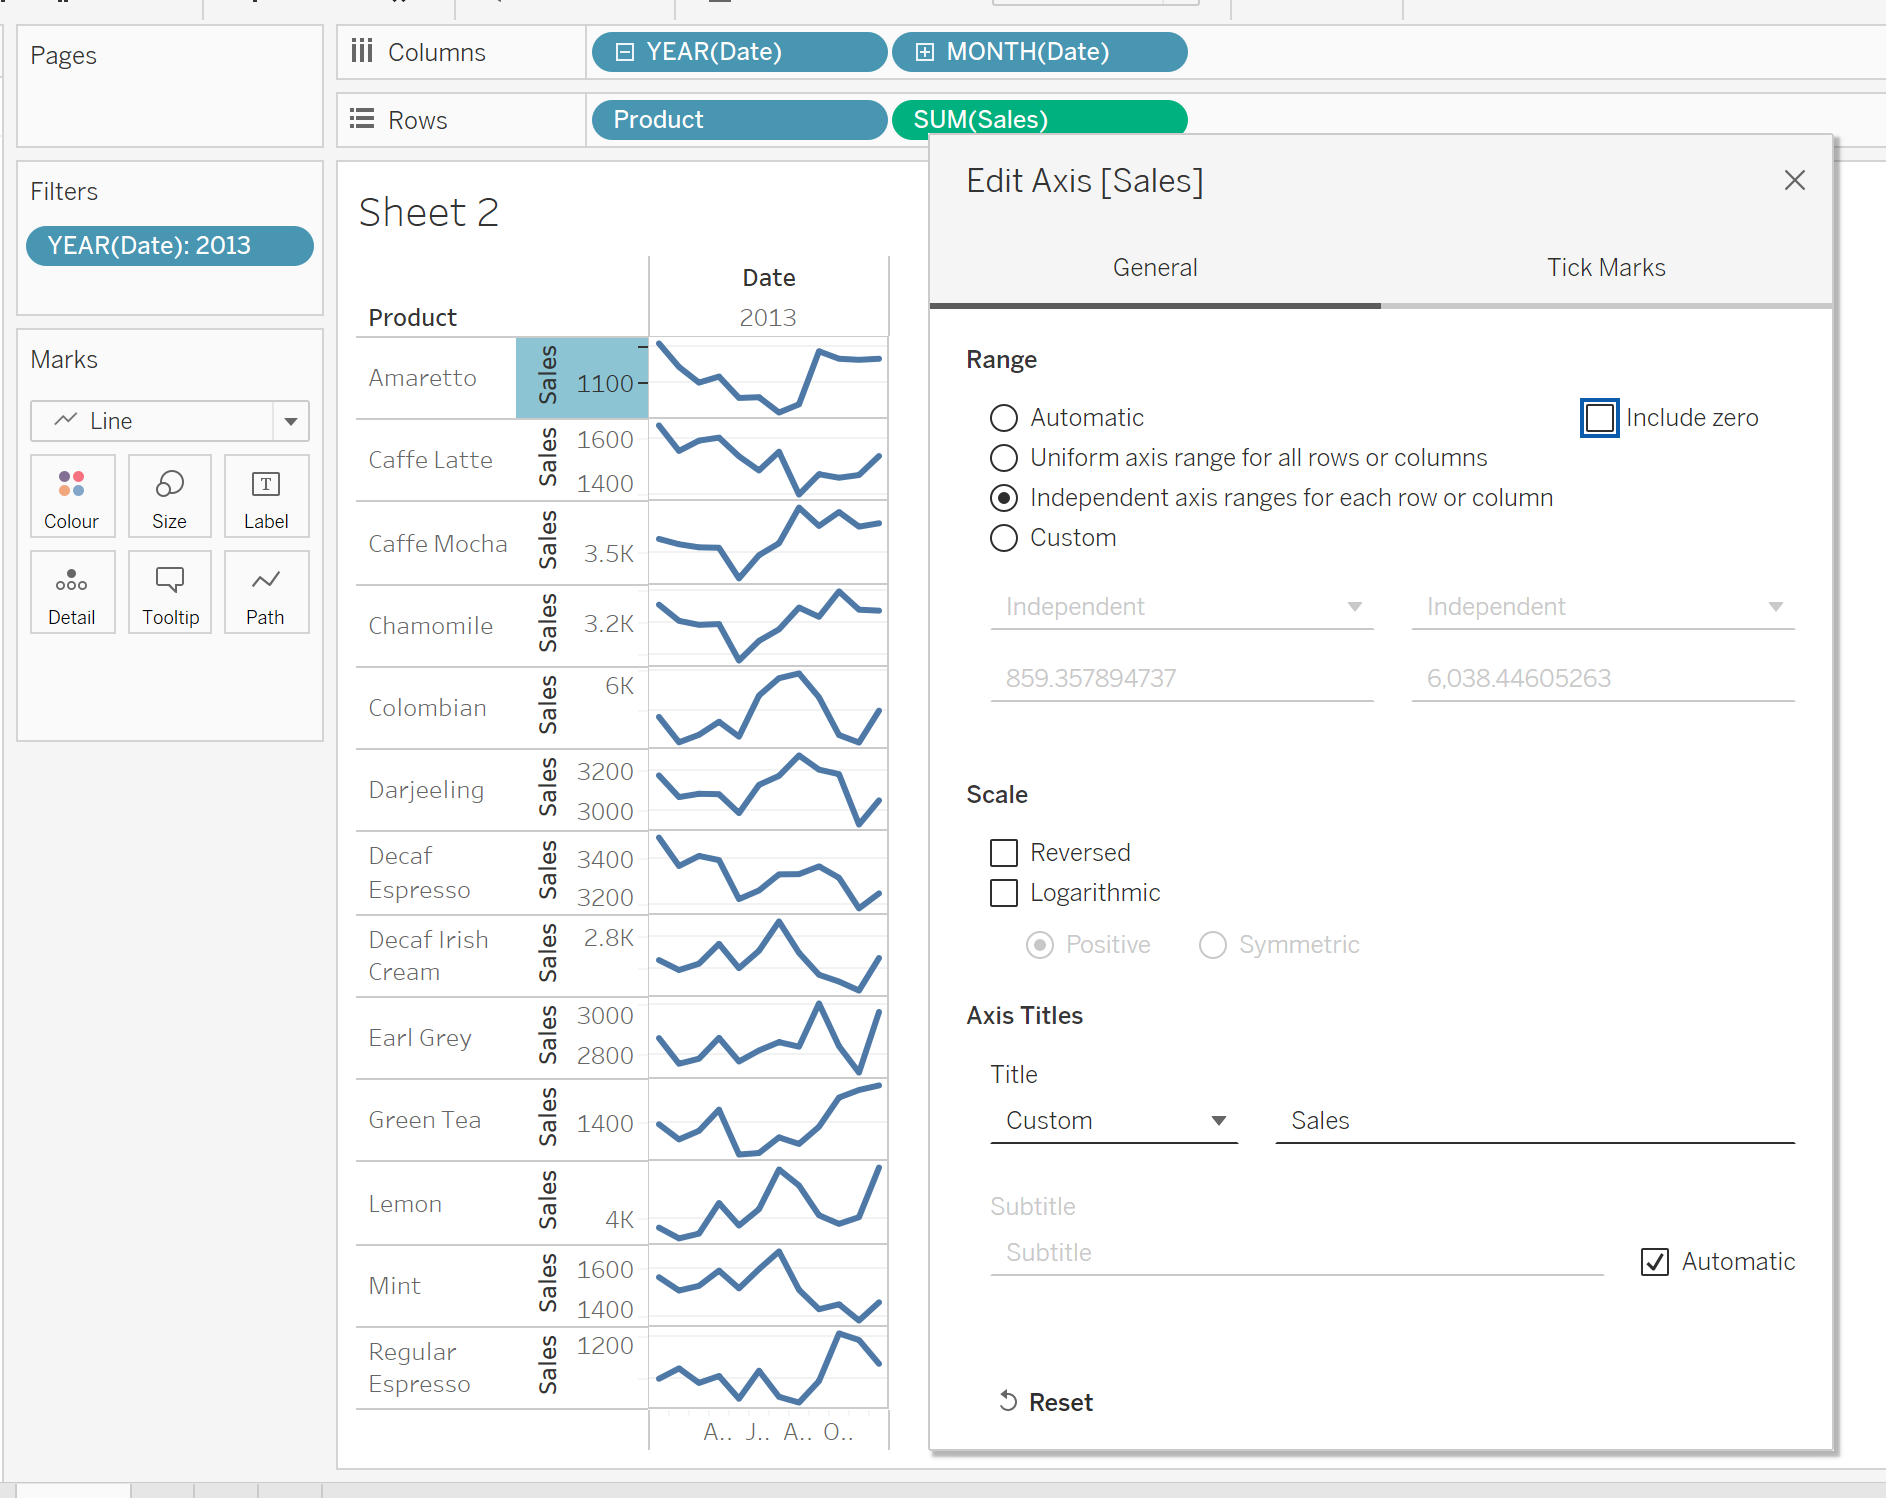
Creating Sparklines
Drawing line graph,
Combined to build dashboad.
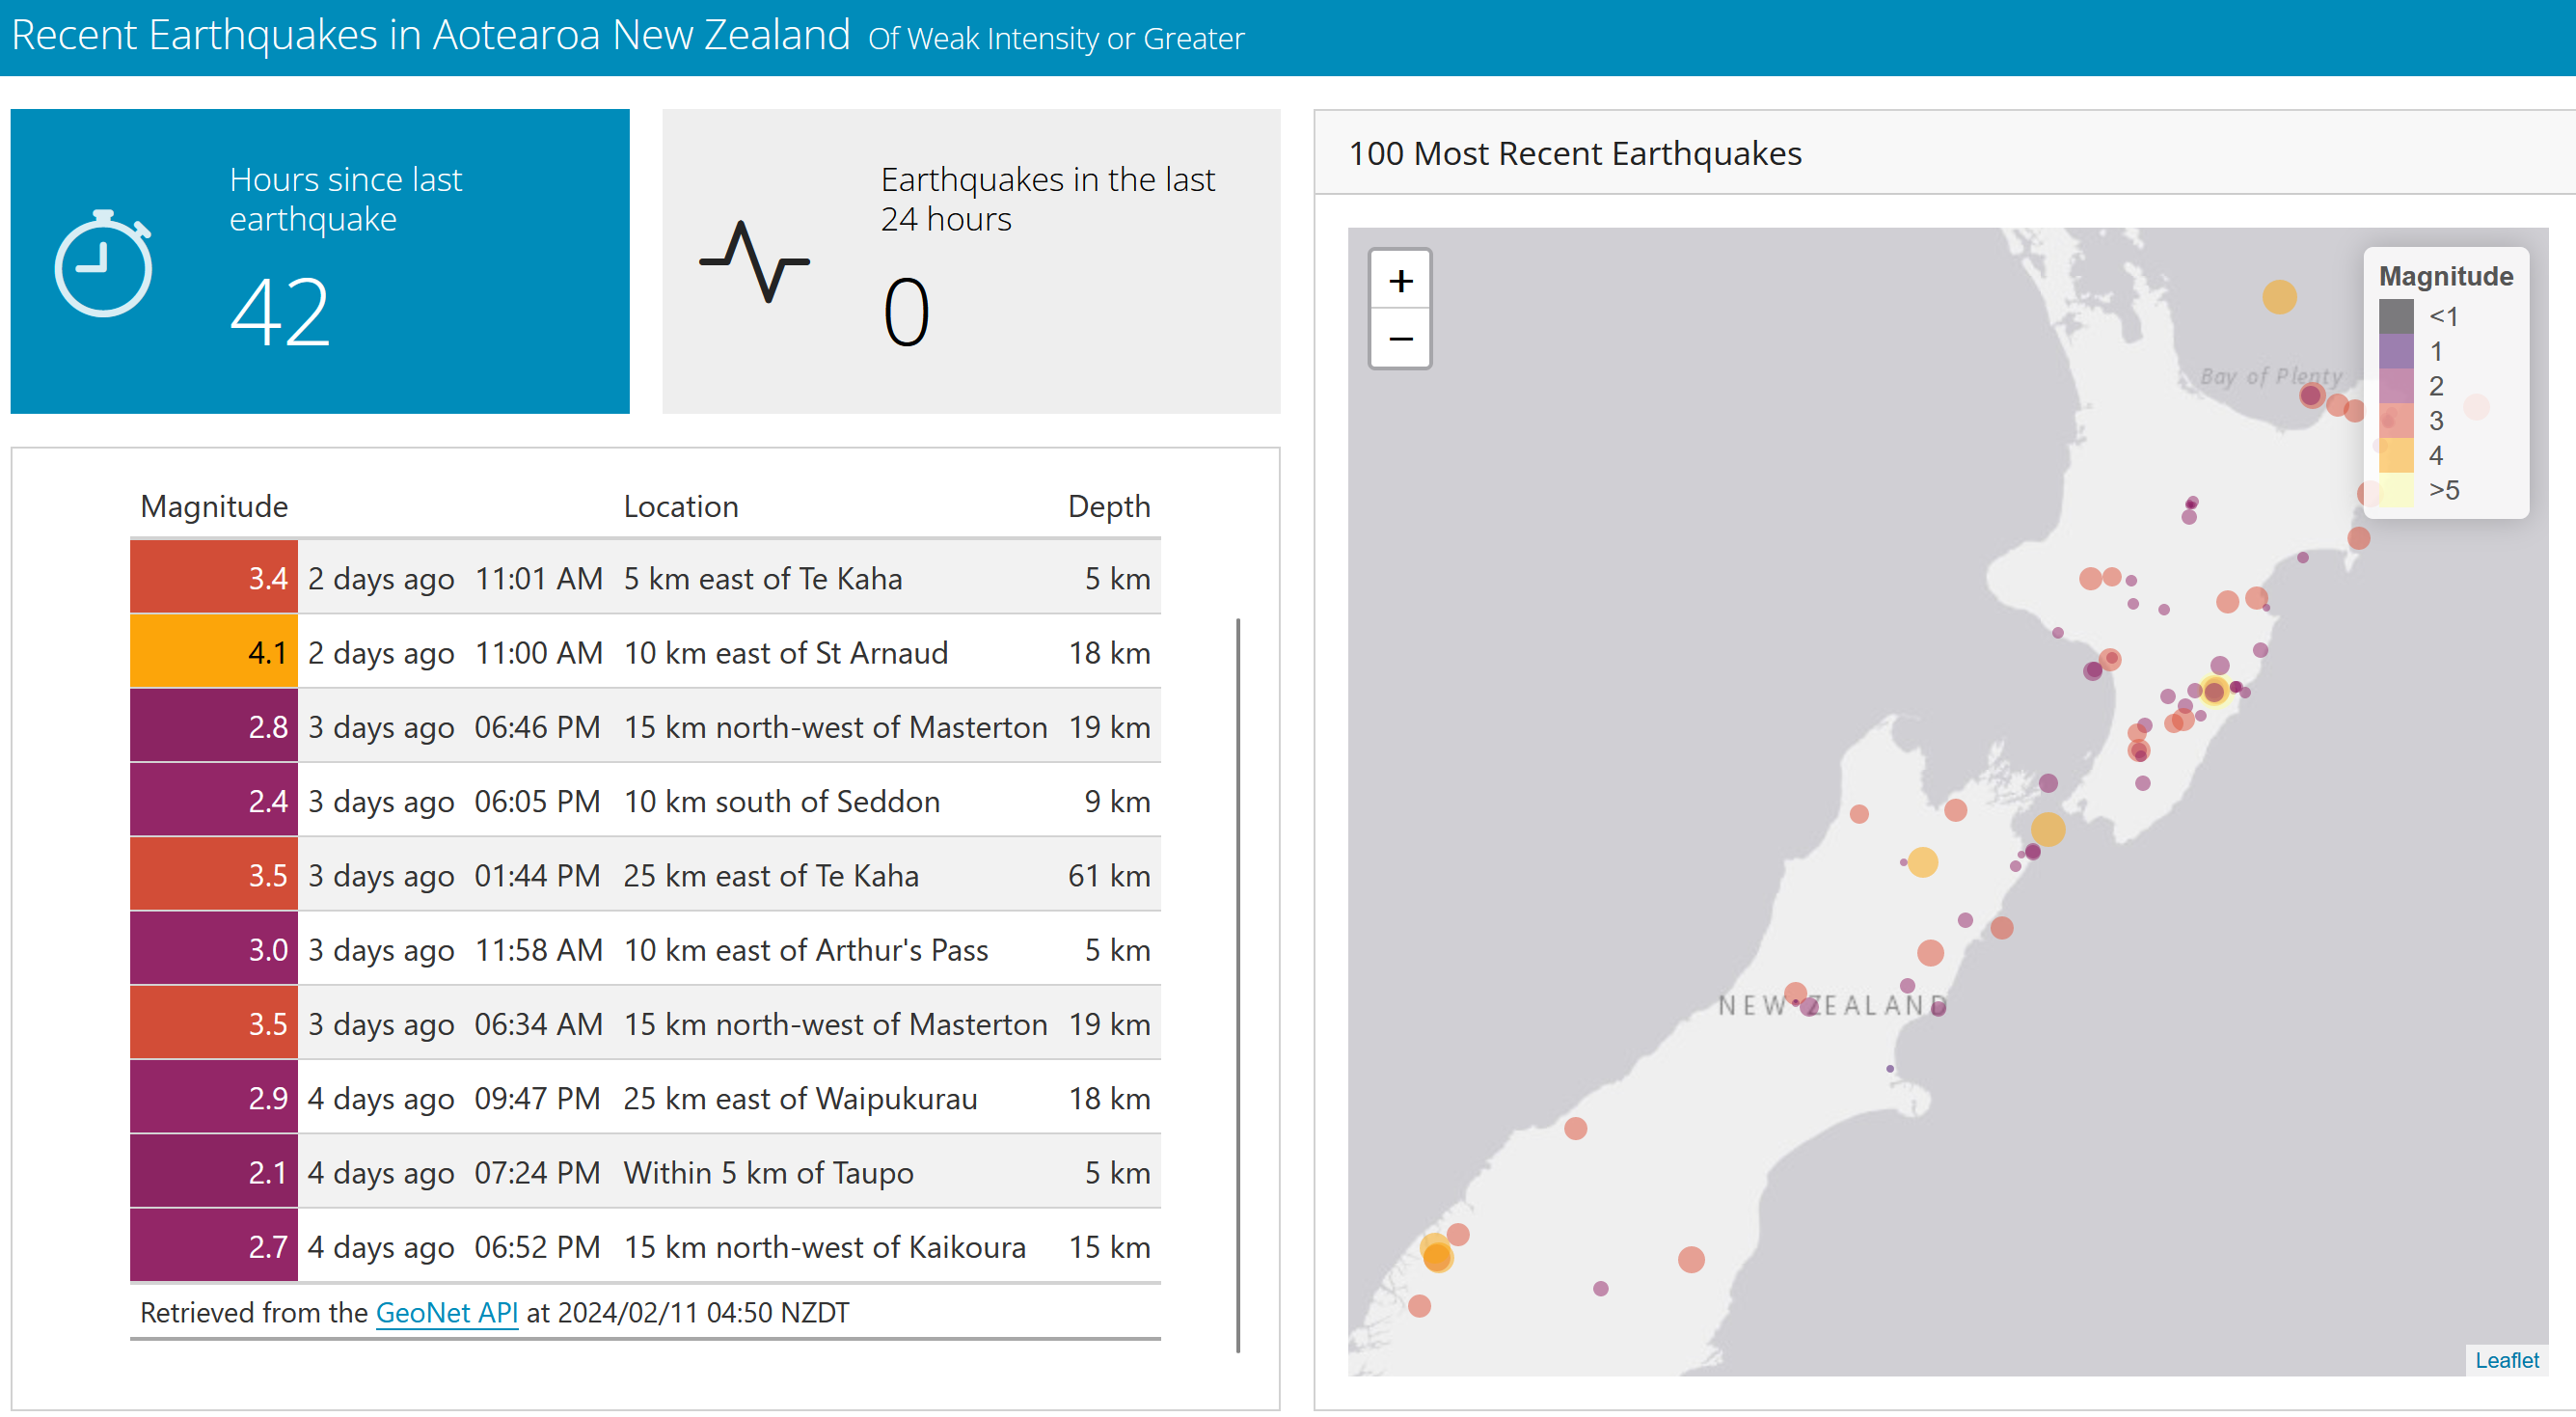
Quarto Dashboard
https://quarto.org/docs/dashboards/
Examples: