library(rsconnect)

rsconnect::deployApp('prototype02/')In Class Ex - Geospatial
1. Using Tableau
1.1 Using Realis 2023 Data
Prepare the data using Tableau - using the drag and drop function to union the various datasets
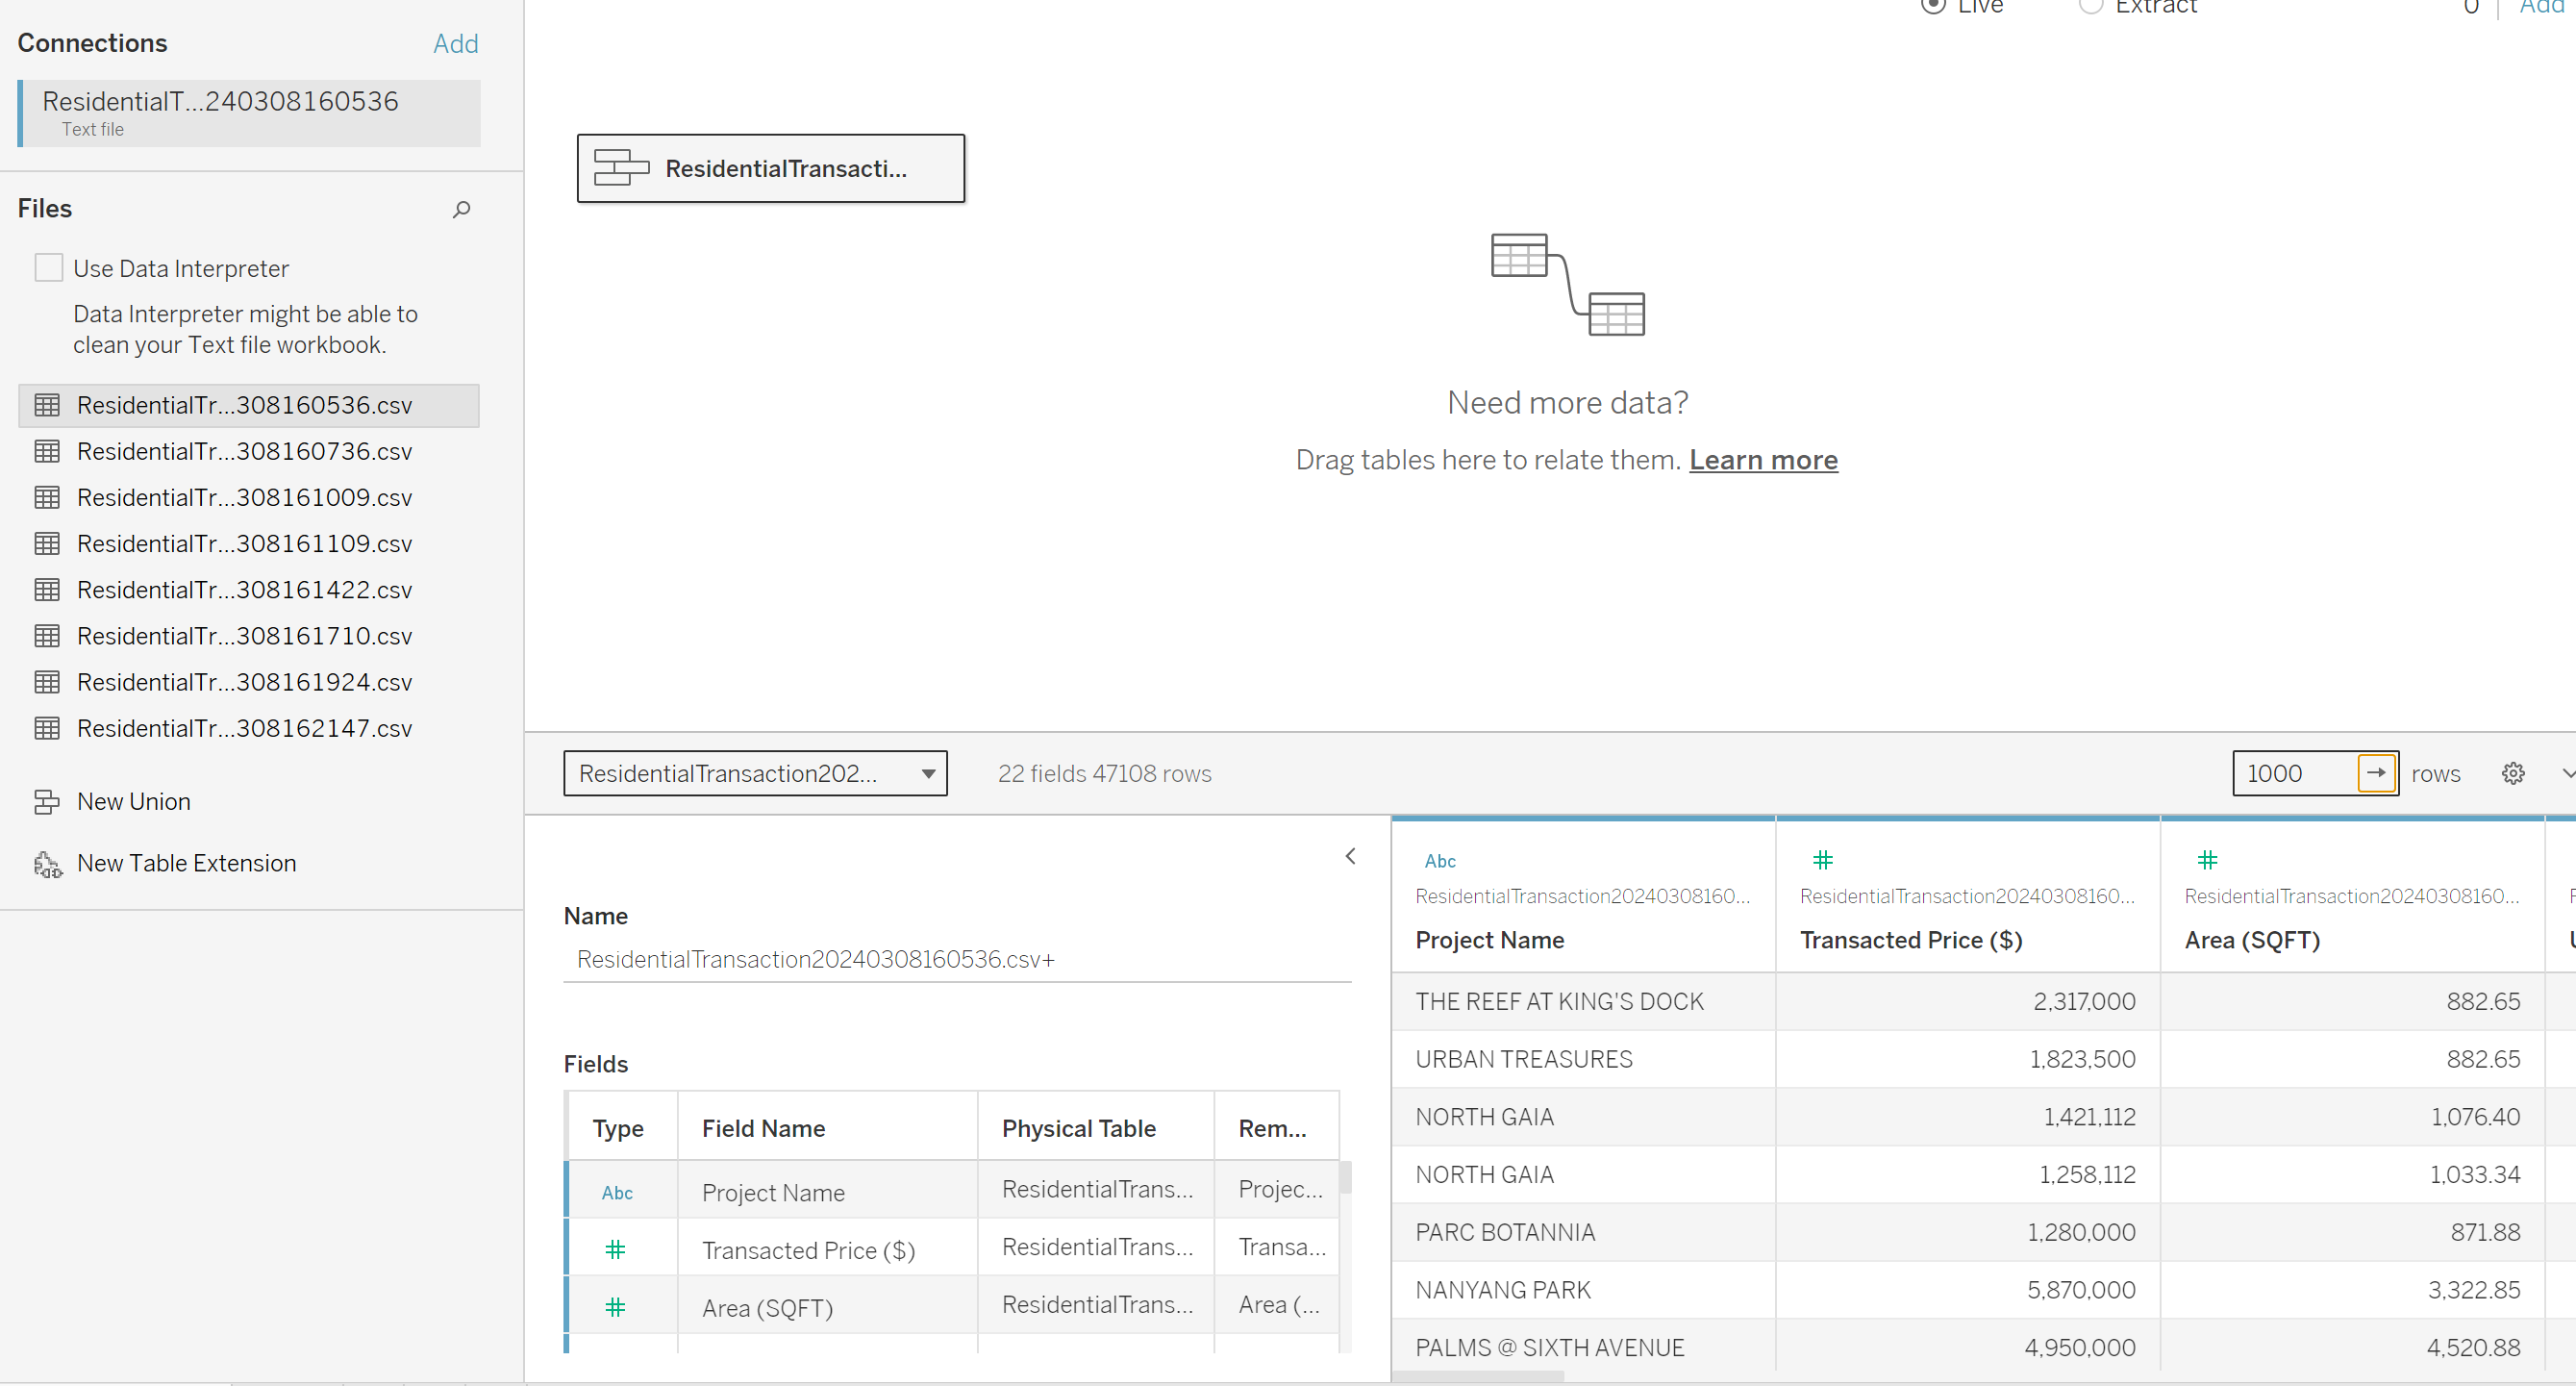
May have issues - sometimes adjust the number of rows to overcome the issue of 0 rows.
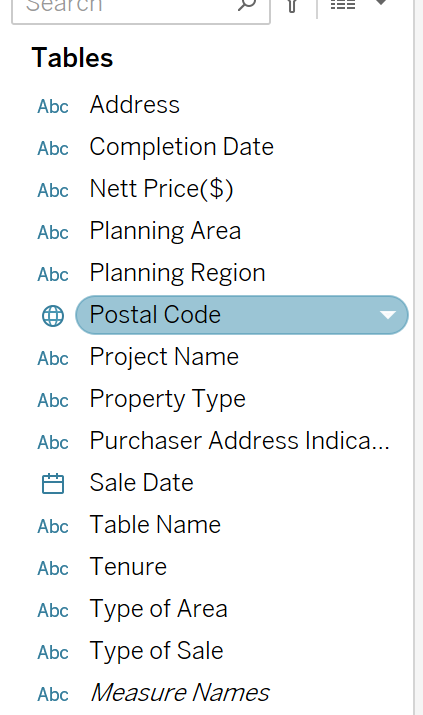
Tableau can auto detect the postal code and set as zipcode/postcode geographical data.
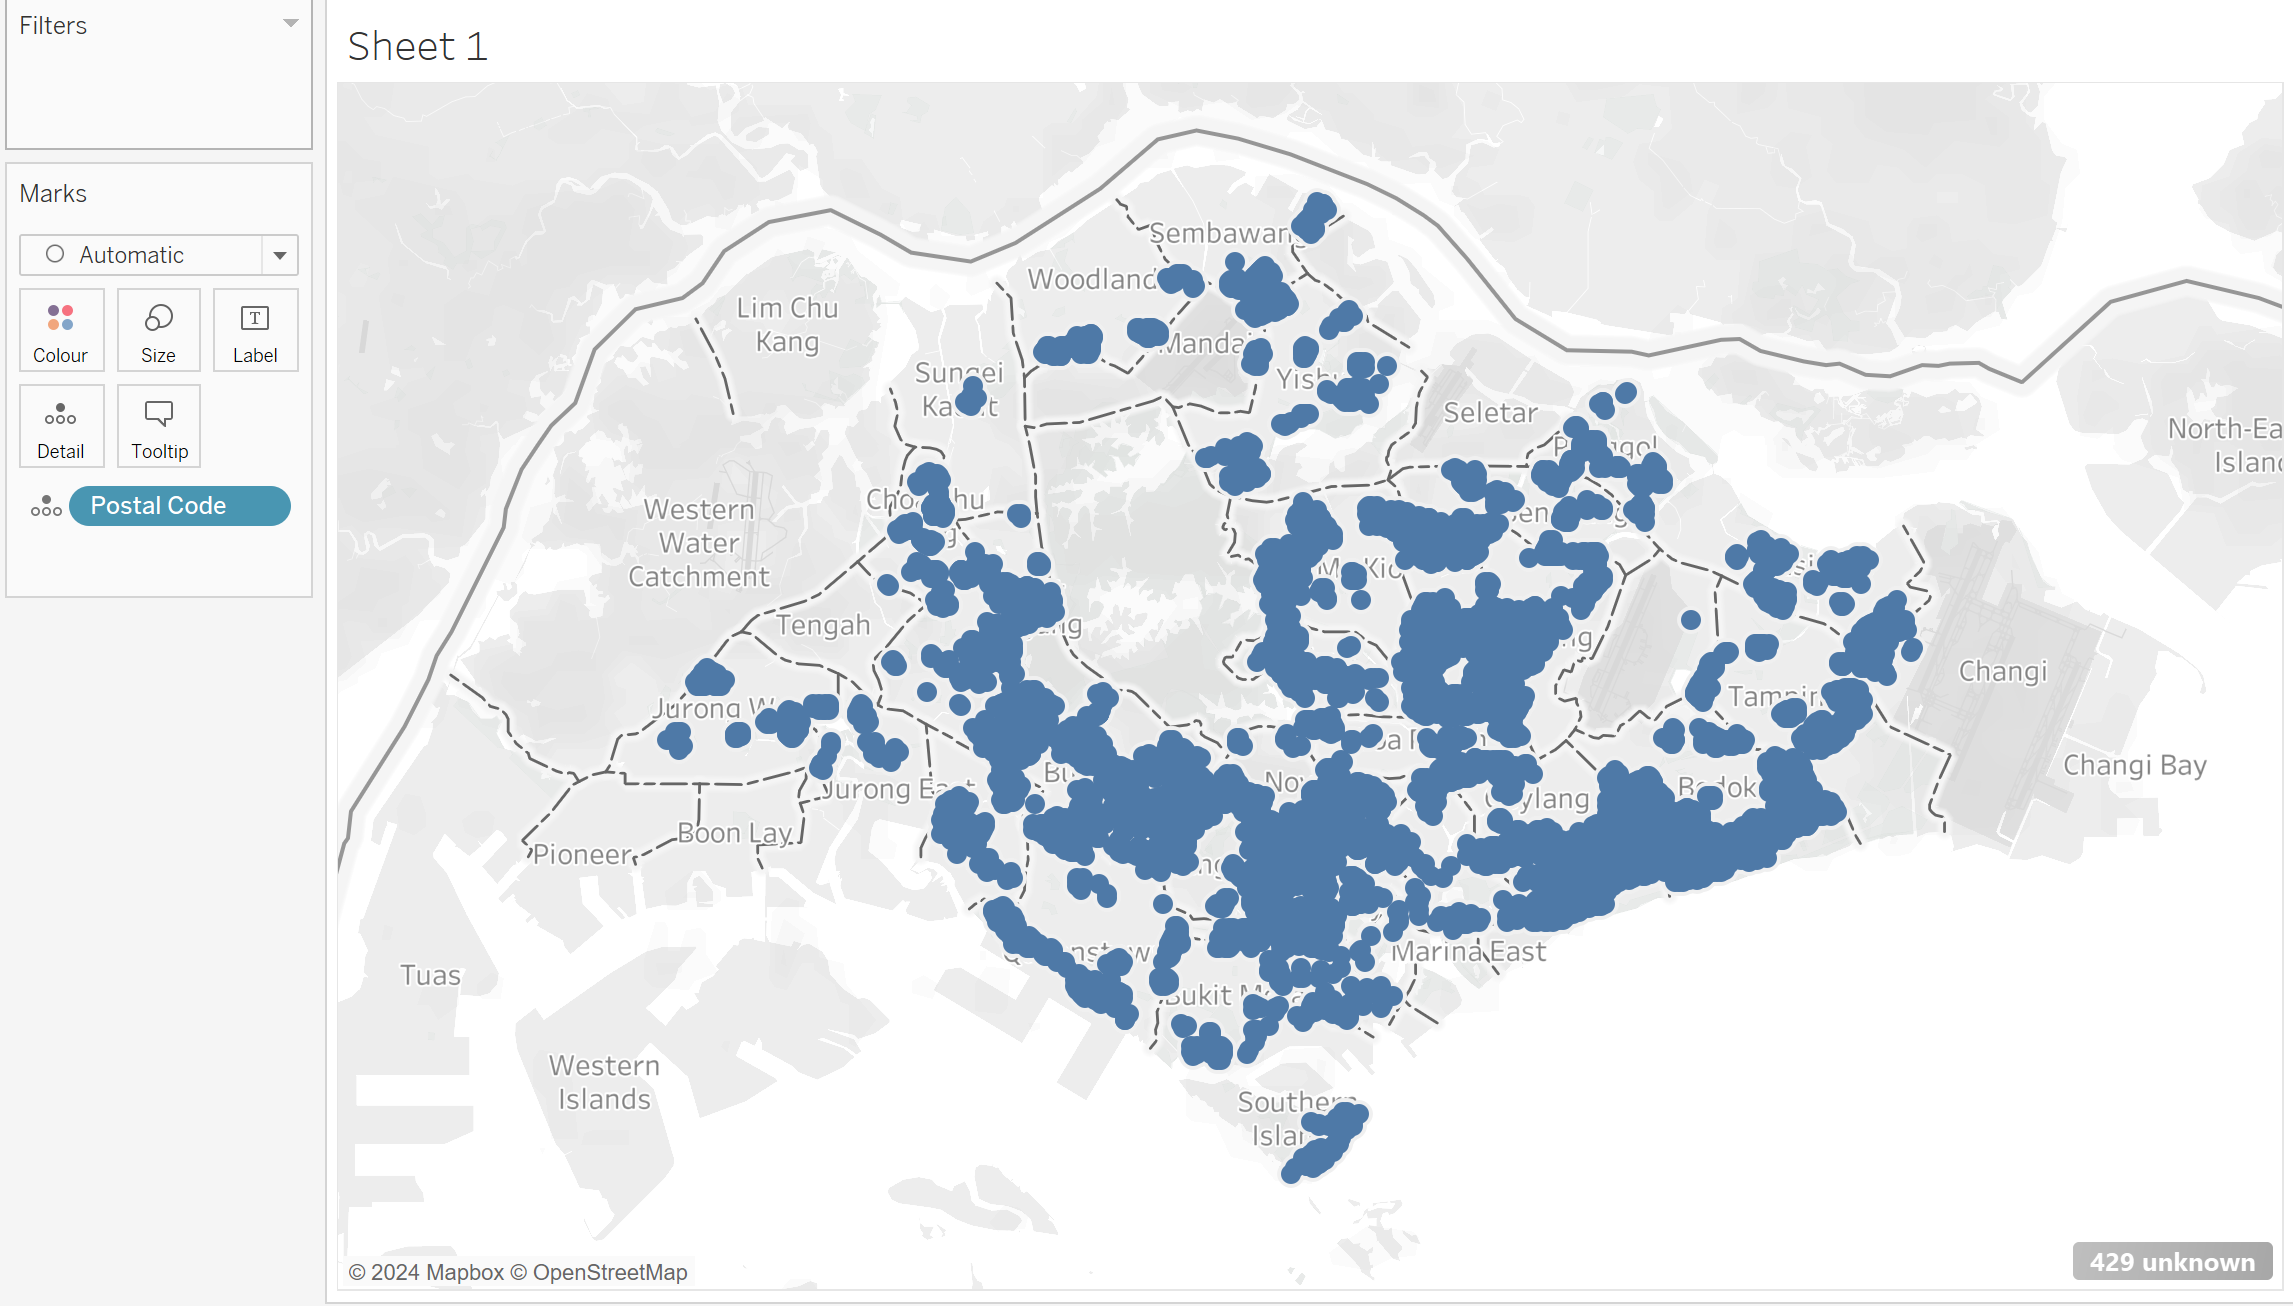
Drag and drop the postal code into the center:
1.2 Looking at the median price etc
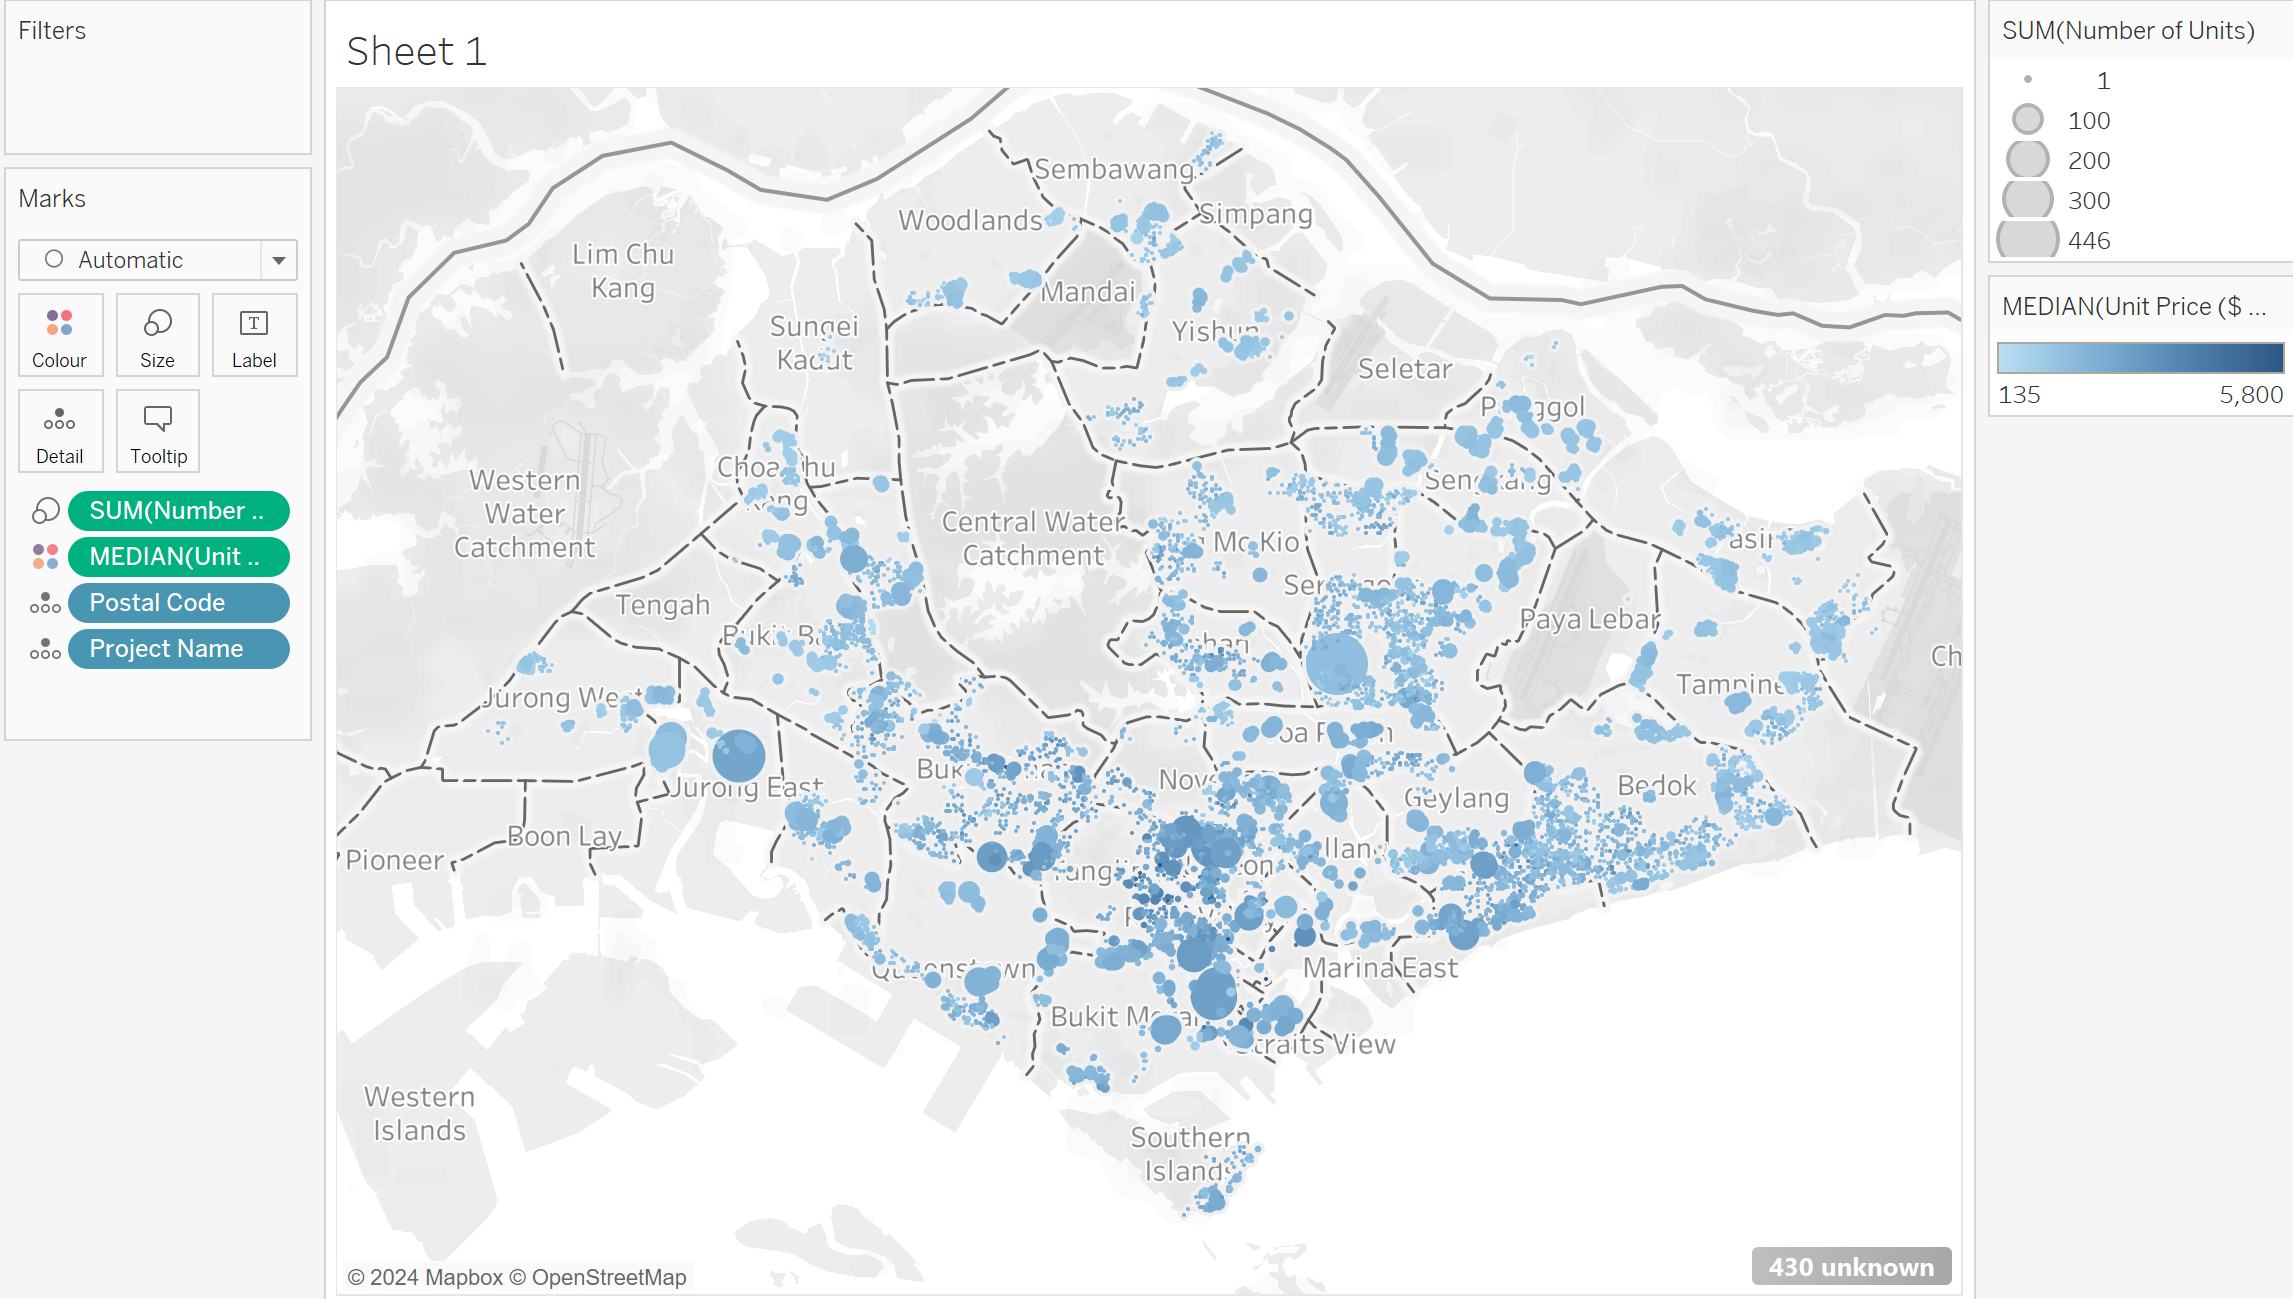
Include filters to the map:
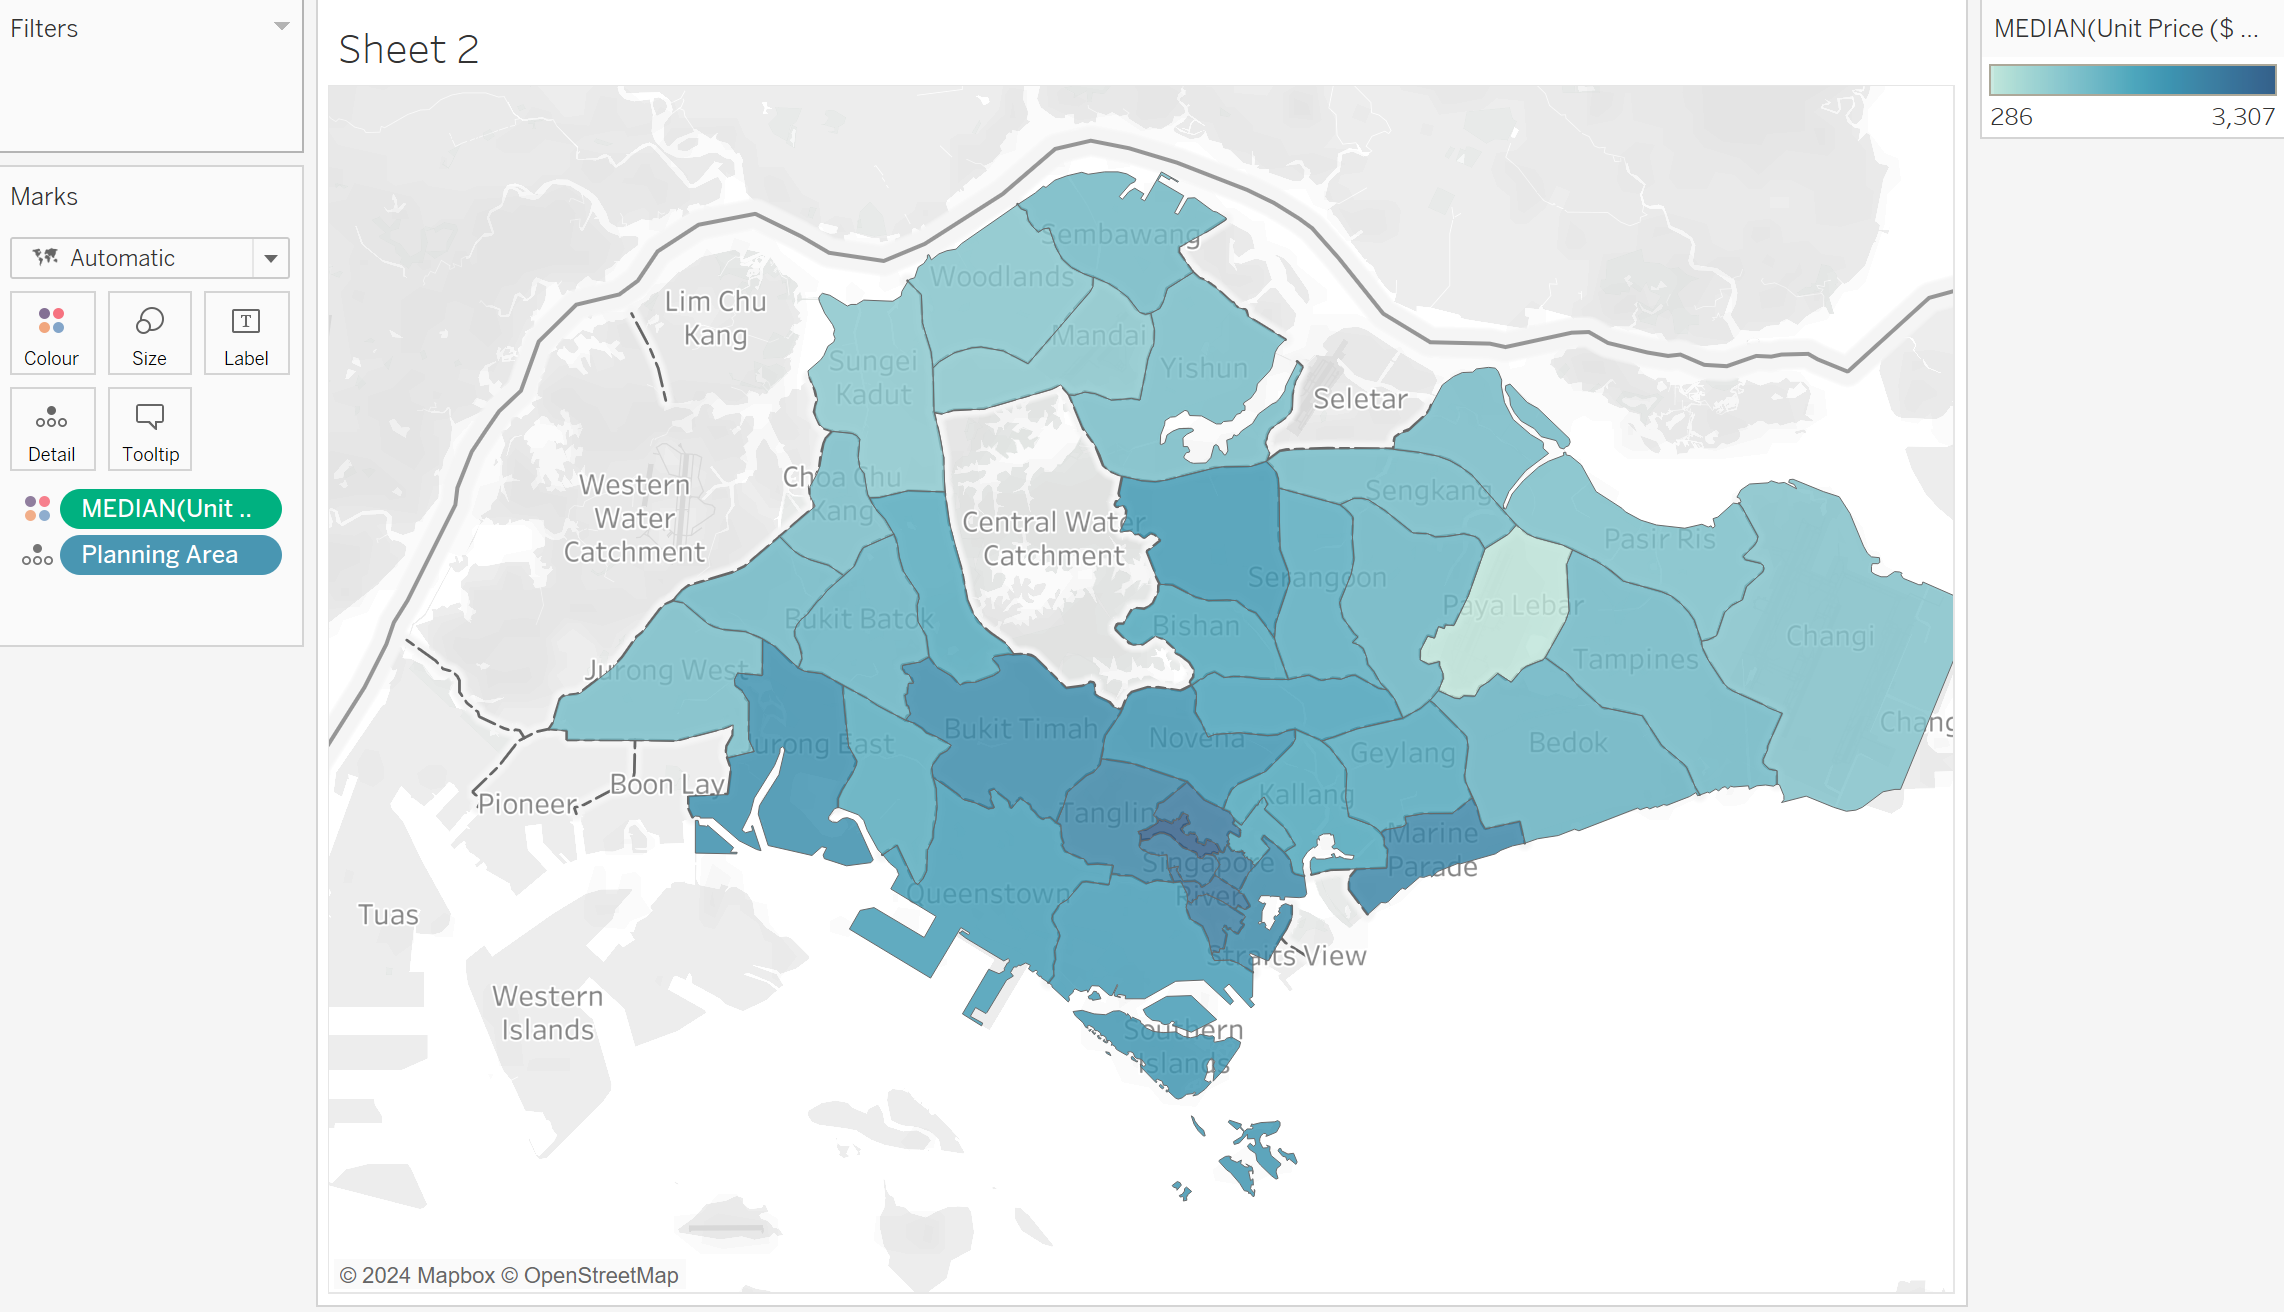
1.3. Chloropleth Maps
Tableau can auto-recognise the planning areas - but may not be 100% correct.
Right click and select Geographical Role -> Province / State.
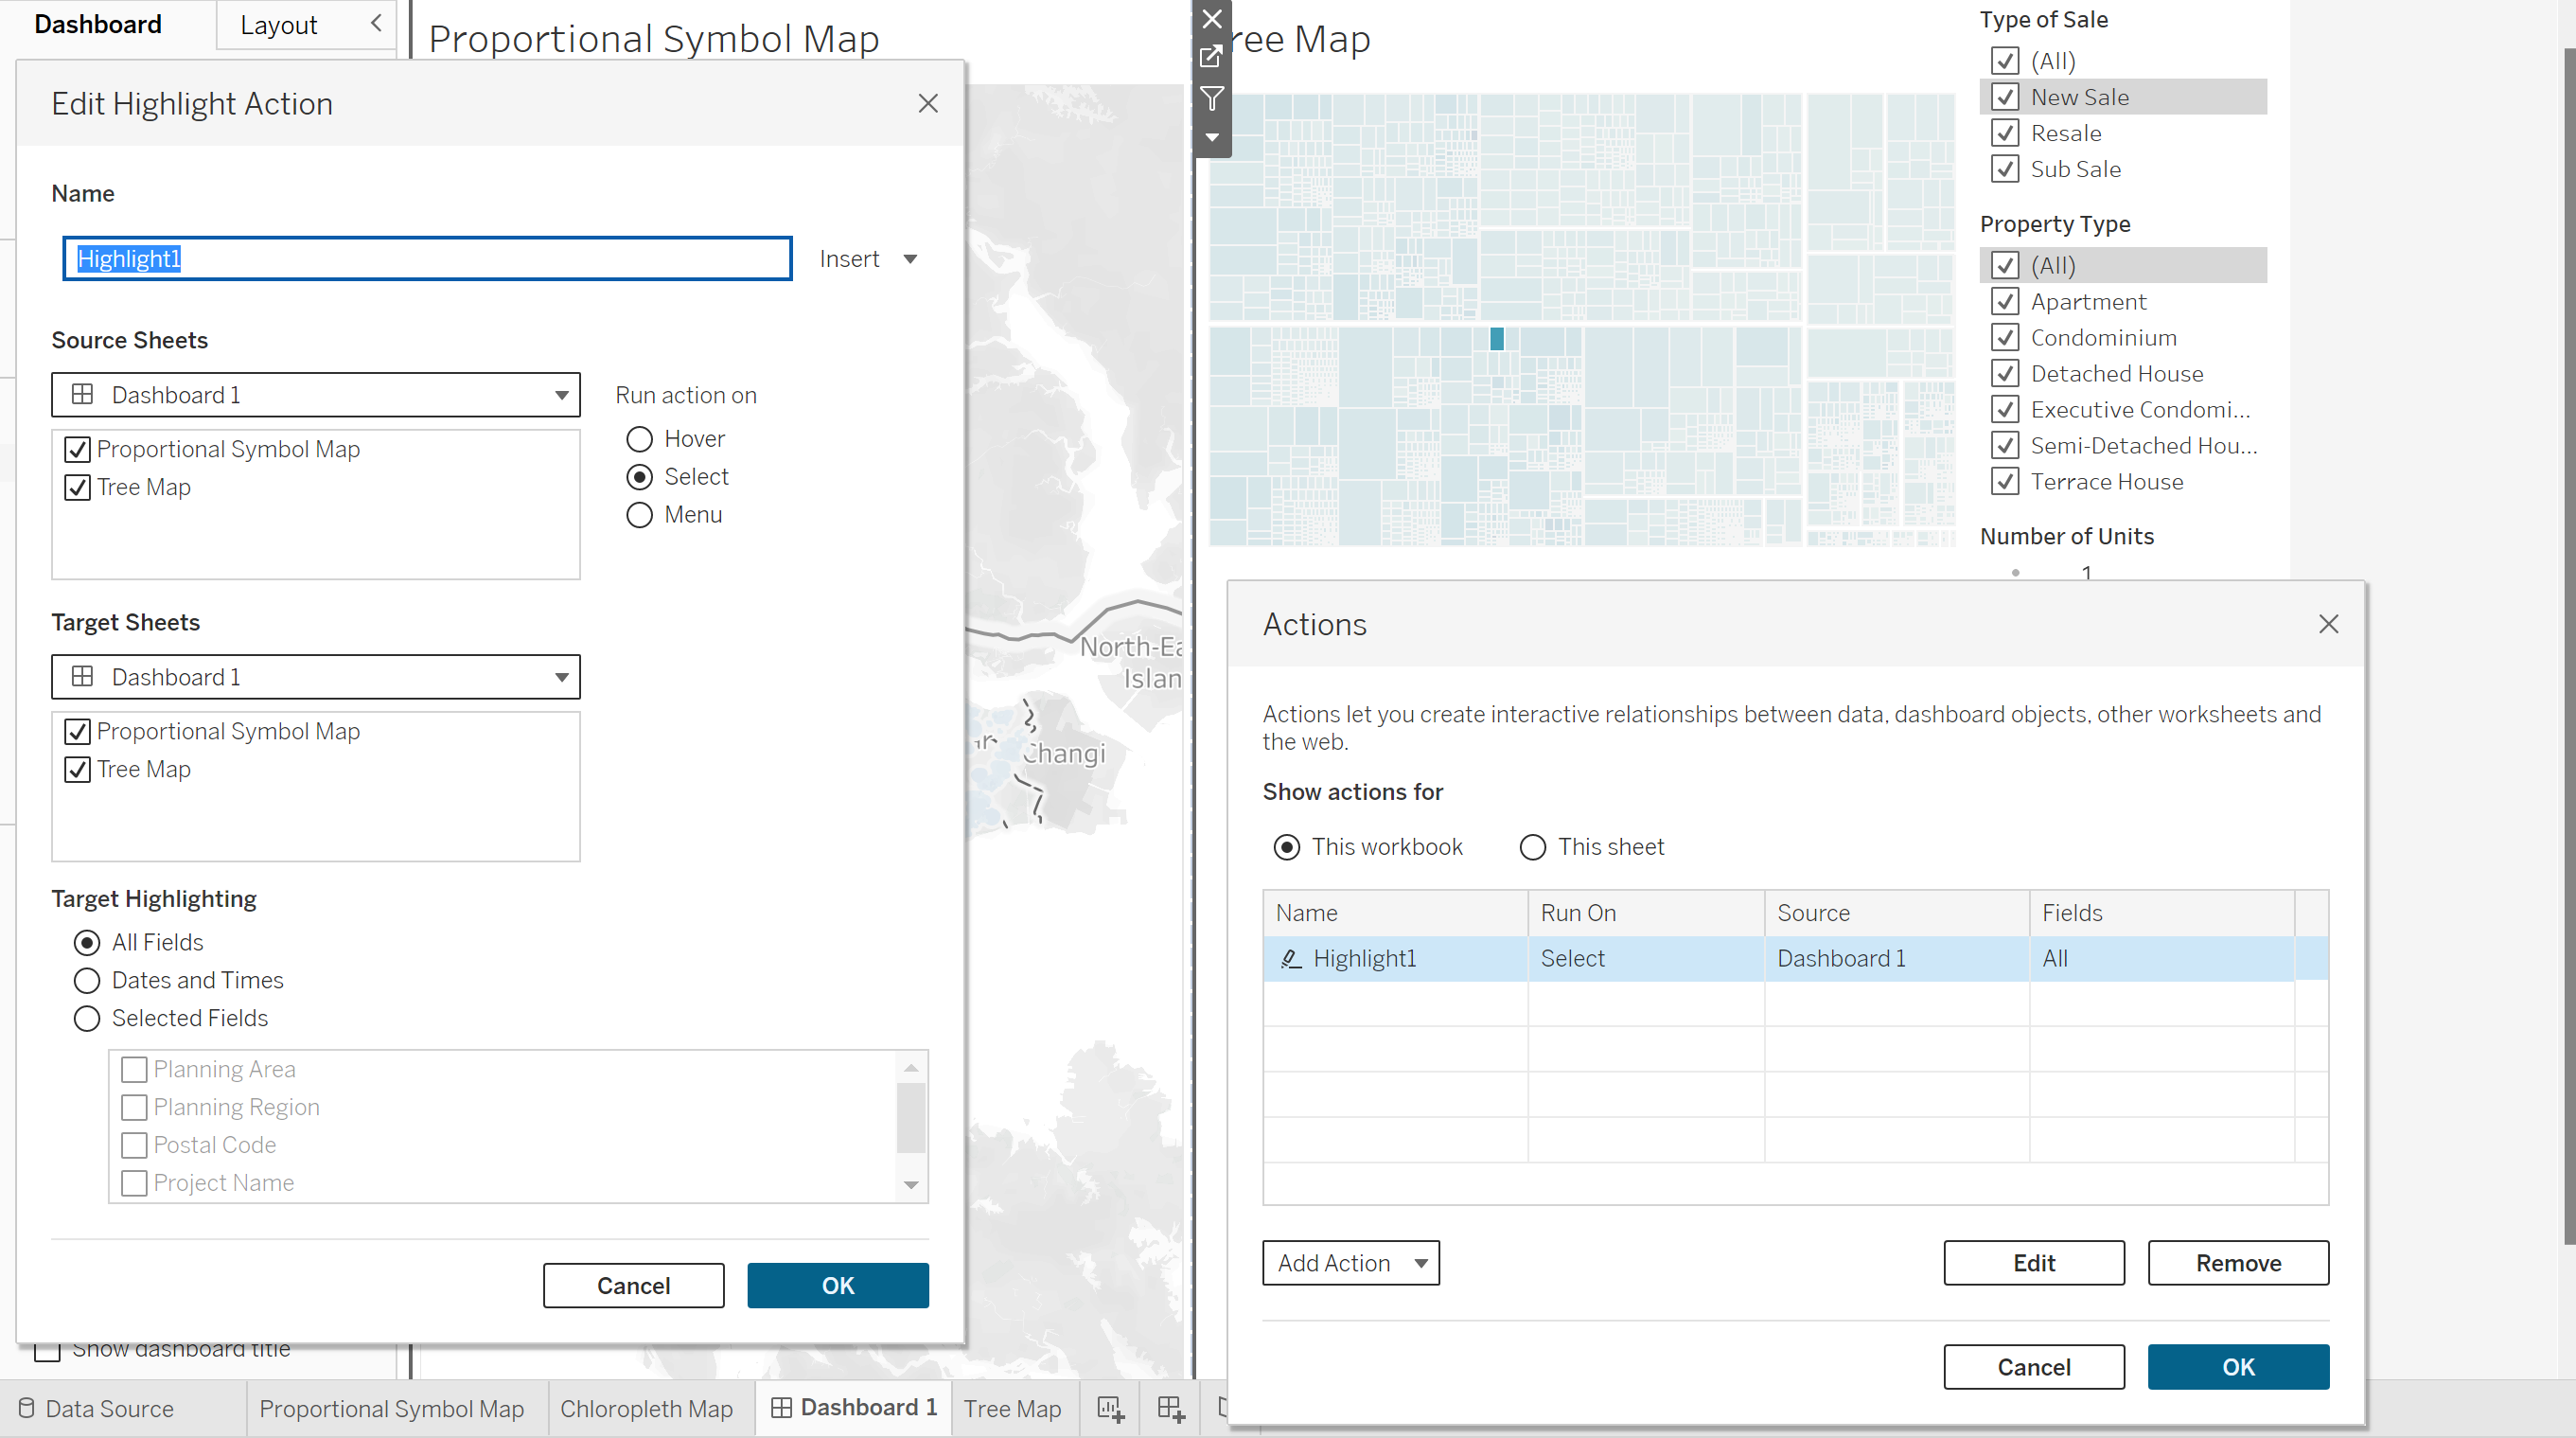
1.4 Creating the Dashboard
2. Deploying of Shiny Apps
Install rsconnect package
Sign up account at shinyapps.io
Follow steps to connect the rsconnect to the project.
Or click through the Publish button after you run the app in Rstudio.
The apps will be published:
https://zjjgithub.shinyapps.io/prototype02/
The data has to go together with the deployment.
Packages must be available through RCRAN - otherwise cannot use!